Fig. 3
Download original image
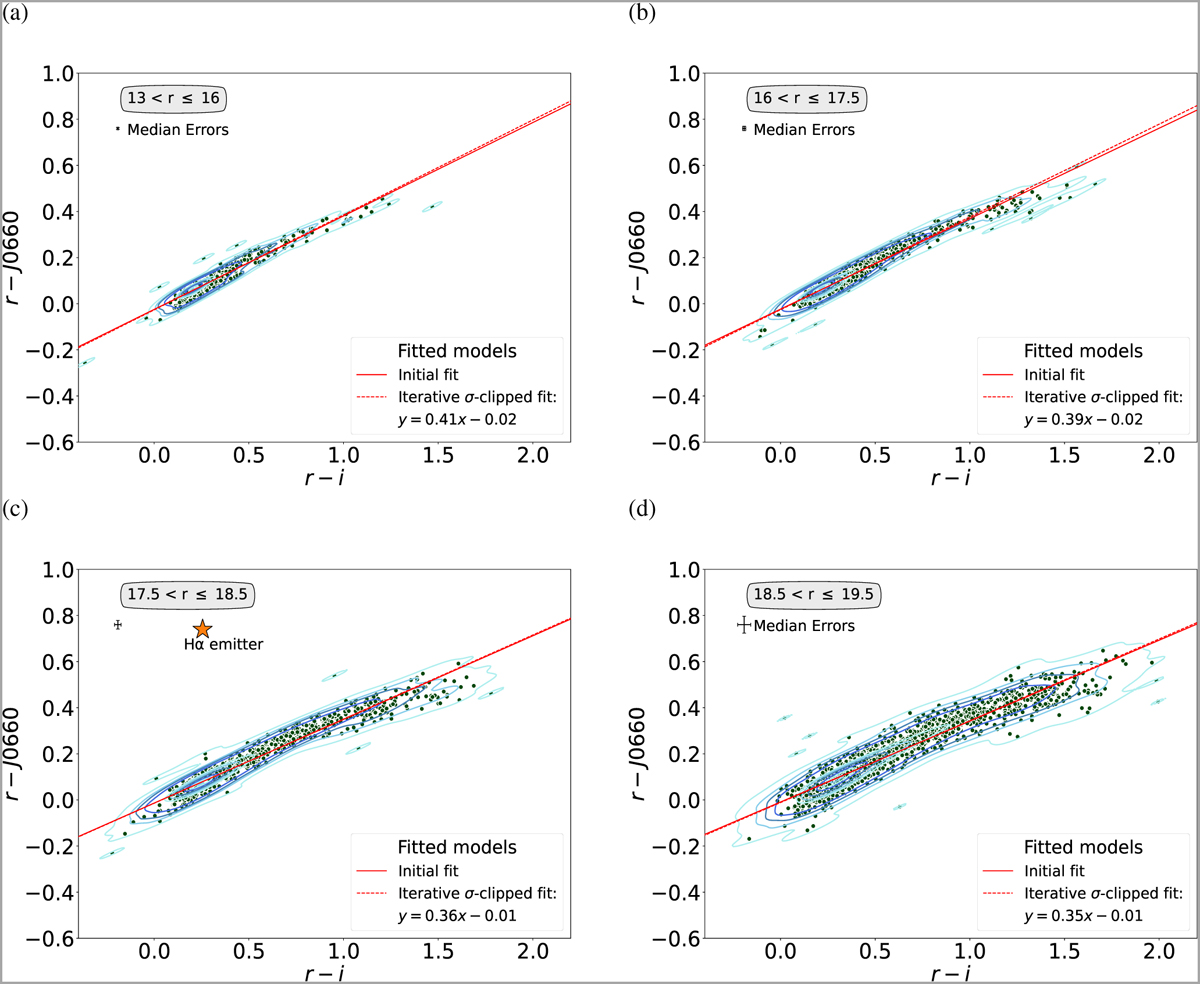
Illustration of the selection criteria used to identify strong emission-line objects via colour–colour plots. The data shown here are from the S-PLUS field STRIPE82-0142, split into four magnitude bins, as displayed in the four panels. The thin red continuous lines show the initial linear fit to all data points (in green), while the dashed red line is the fit after applying iterative σ-clipping. Objects selected as Hα emitters are located above the dashed line. The orange star in panel c represents the cataclysmic variable (CV) FASTT 1560 (S-PLUS ID: DR4_3_STRIPE82-0142_0021237), highlighted here as an example of an Hα emitter identified by our criteria.
Current usage metrics show cumulative count of Article Views (full-text article views including HTML views, PDF and ePub downloads, according to the available data) and Abstracts Views on Vision4Press platform.
Data correspond to usage on the plateform after 2015. The current usage metrics is available 48-96 hours after online publication and is updated daily on week days.
Initial download of the metrics may take a while.