Fig. 2
Download original image
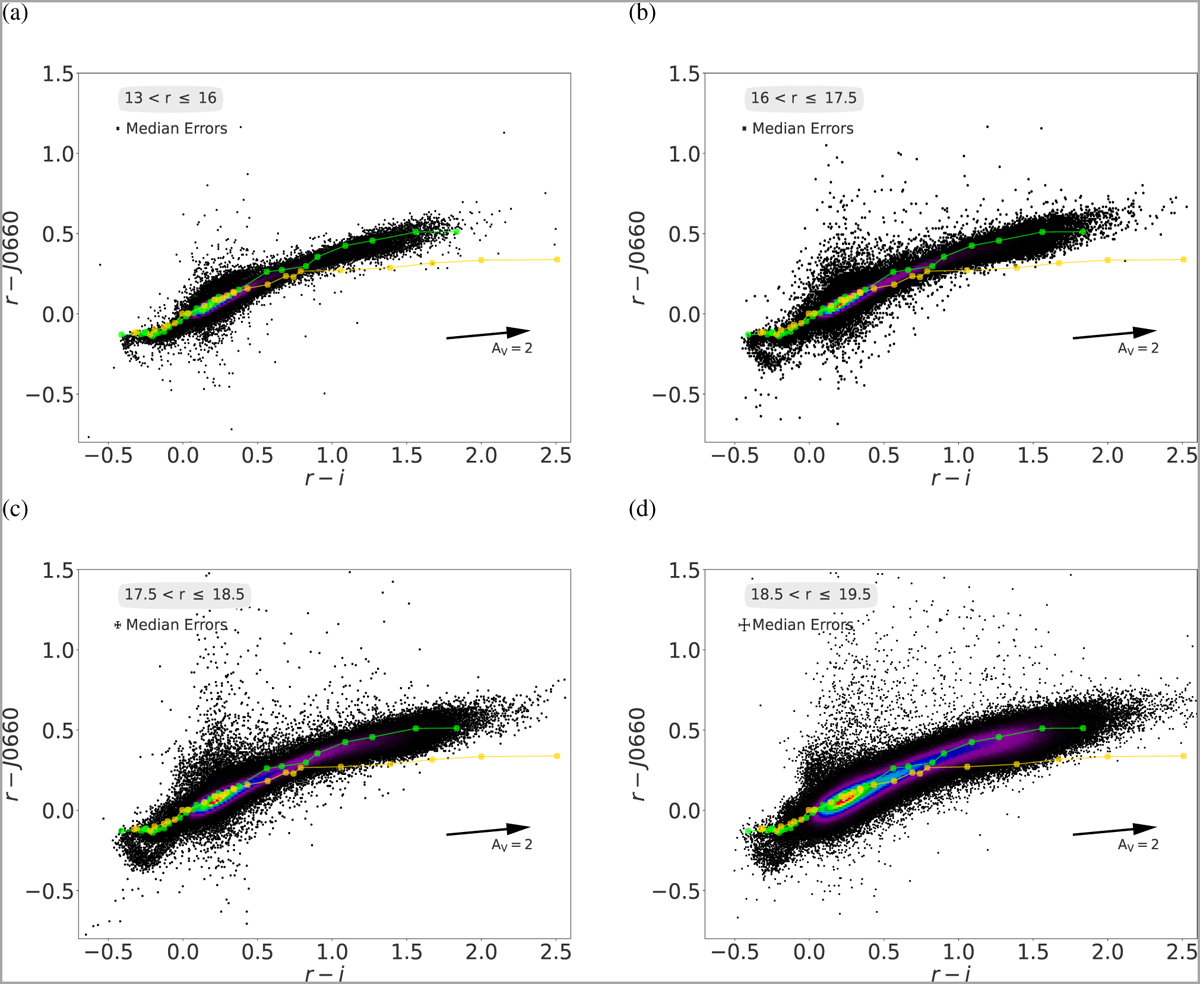
(r – J0660) versus (r – i) colour–colour plots used to select objects with Hα excess. These plots display data for all stars from the S-PLUS DR4 MS, representing the PStotal photometry in these colours. The data are divided into four magnitude bins: (a) 13 < r ≤ 16, (b) 16 < r ≤ 17.5, (c) 17.5 < r ≤ 18.5, and (d) 18.5 < r ≤ 19.5. Objects with Hα excess are expected to be located towards the top of these diagrams. The lighter green and yellow points connected by lines represent the tracks for main-sequence and giant stars, respectively. These tracks are derived from the synthetic spectra library of Pickles (1998). The background colour gradient represents the density of objects: red indicates the highest concentration of points, followed by green, blue, and purple, which represent progressively lower concentrations.
Current usage metrics show cumulative count of Article Views (full-text article views including HTML views, PDF and ePub downloads, according to the available data) and Abstracts Views on Vision4Press platform.
Data correspond to usage on the plateform after 2015. The current usage metrics is available 48-96 hours after online publication and is updated daily on week days.
Initial download of the metrics may take a while.