Open Access
Fig. B.2
Download original image
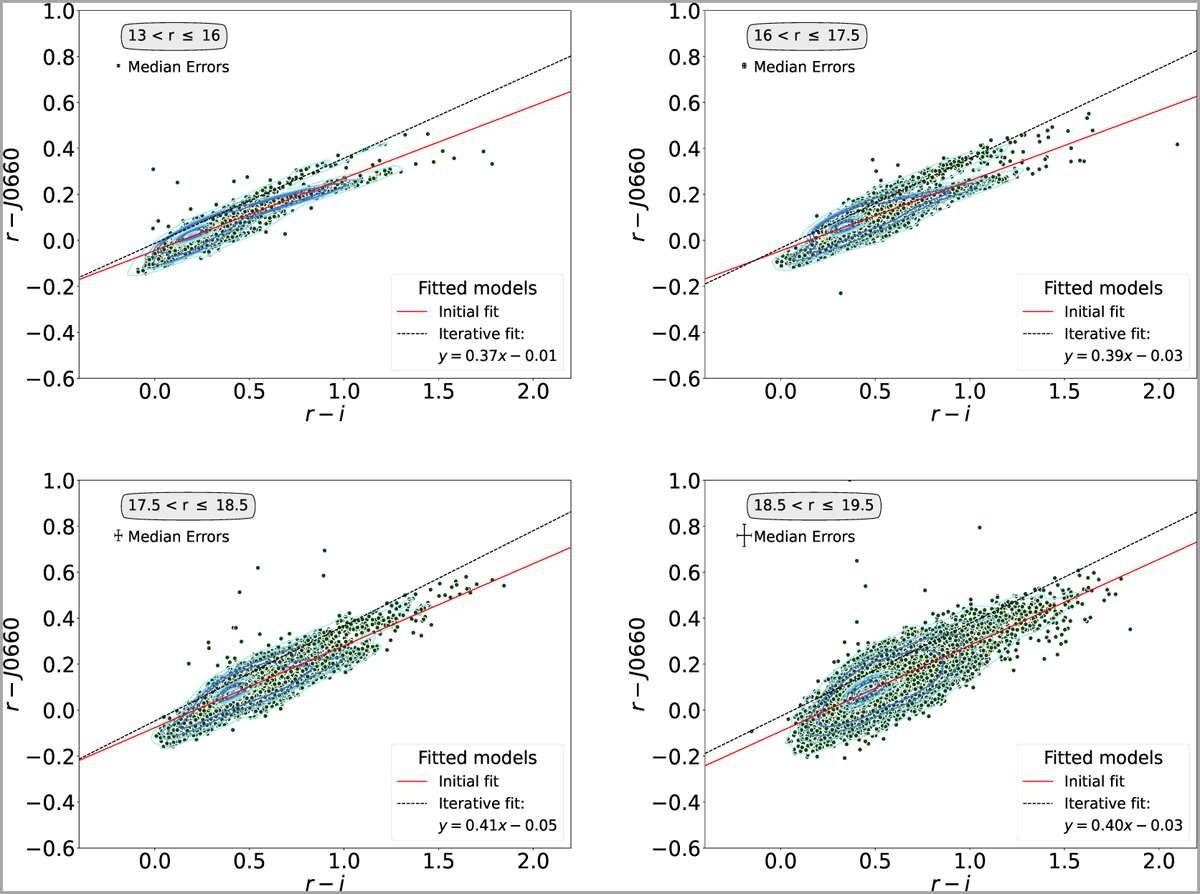
Colour-colour diagram of the stars located at field SPLUS-d288 of the GDS, similar to those found in Fig. 3. The red lines represent the original fit to all data, while the black dashed lines represent the final fits to the upper locus of points, obtained by applying an iterative fitting process to the initial fit.
Current usage metrics show cumulative count of Article Views (full-text article views including HTML views, PDF and ePub downloads, according to the available data) and Abstracts Views on Vision4Press platform.
Data correspond to usage on the plateform after 2015. The current usage metrics is available 48-96 hours after online publication and is updated daily on week days.
Initial download of the metrics may take a while.