Open Access
Fig. 14
Download original image
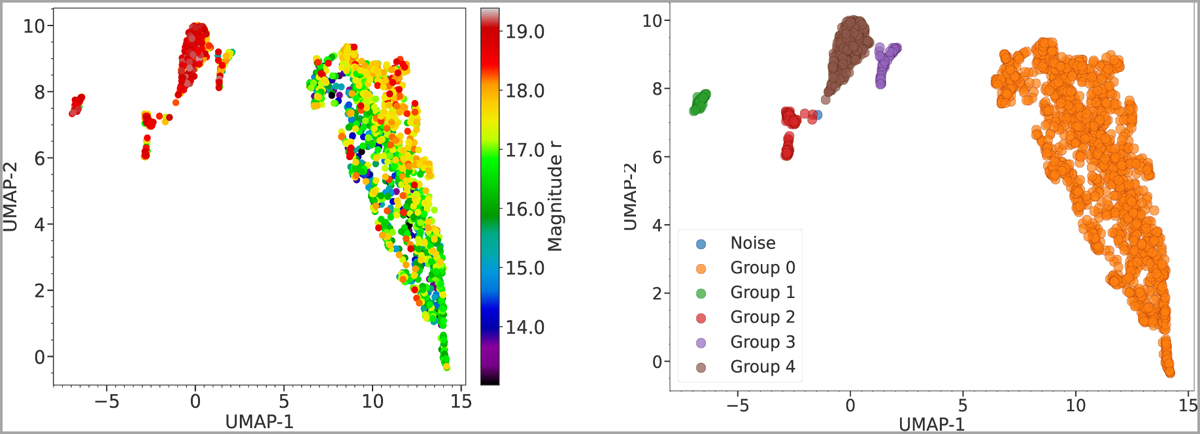
Similar to Fig. 13, but with additional features created using the W1 and W2 bands from WISE. The left panel shows the UMAP result, with the colour bar indicating the r magnitude, and the right panel shows the HDBSCAN clustering result, identifying five distinct groups.
Current usage metrics show cumulative count of Article Views (full-text article views including HTML views, PDF and ePub downloads, according to the available data) and Abstracts Views on Vision4Press platform.
Data correspond to usage on the plateform after 2015. The current usage metrics is available 48-96 hours after online publication and is updated daily on week days.
Initial download of the metrics may take a while.