Fig. 8.
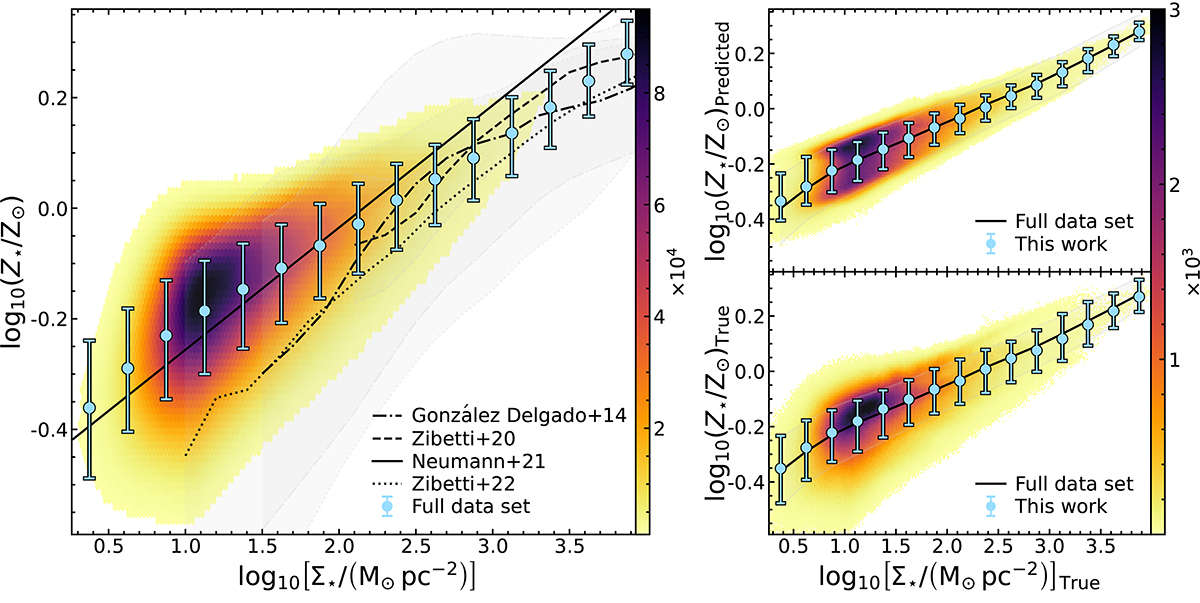
Download original image
Density plots of the distribution of log10(Z⋆/Z⊙) as a function of log10[Σ⋆/(M⊙ pc−2)]. Large light-blue points with error bars represent the median, 16th and 84th percentile of the values of log10Z⋆ per each log10Σ⋆ bin. Left: The entire data set, consisting of 71 120 654 individual pixels. Only areas with ≥1000 pixels are included. Full, dashed, dash-dotted, and dotted lines represent fits from González Delgado et al. (2014), Zibetti et al. (2020), Neumann et al. (2021), and Zibetti & Gallazzi (2022), respectively. Right: The test data set (consisting of 9 035 270 pixels from 150 galaxies), predicted (top) and true (bottom) Z⋆ as a function of true Σ⋆. Only areas with ≥10 pixels are included. Black line and the grey area marks the median, 16th and 84th percentile of the whole TNG50 data set (the light-blue points with error bars from the plot on the left), while the light-blue points with error bars represent the median, 16th and 84th percentile of log10Z⋆ for each log10Σ⋆ bin in the test set.
Current usage metrics show cumulative count of Article Views (full-text article views including HTML views, PDF and ePub downloads, according to the available data) and Abstracts Views on Vision4Press platform.
Data correspond to usage on the plateform after 2015. The current usage metrics is available 48-96 hours after online publication and is updated daily on week days.
Initial download of the metrics may take a while.