Fig. 5.
Download original image
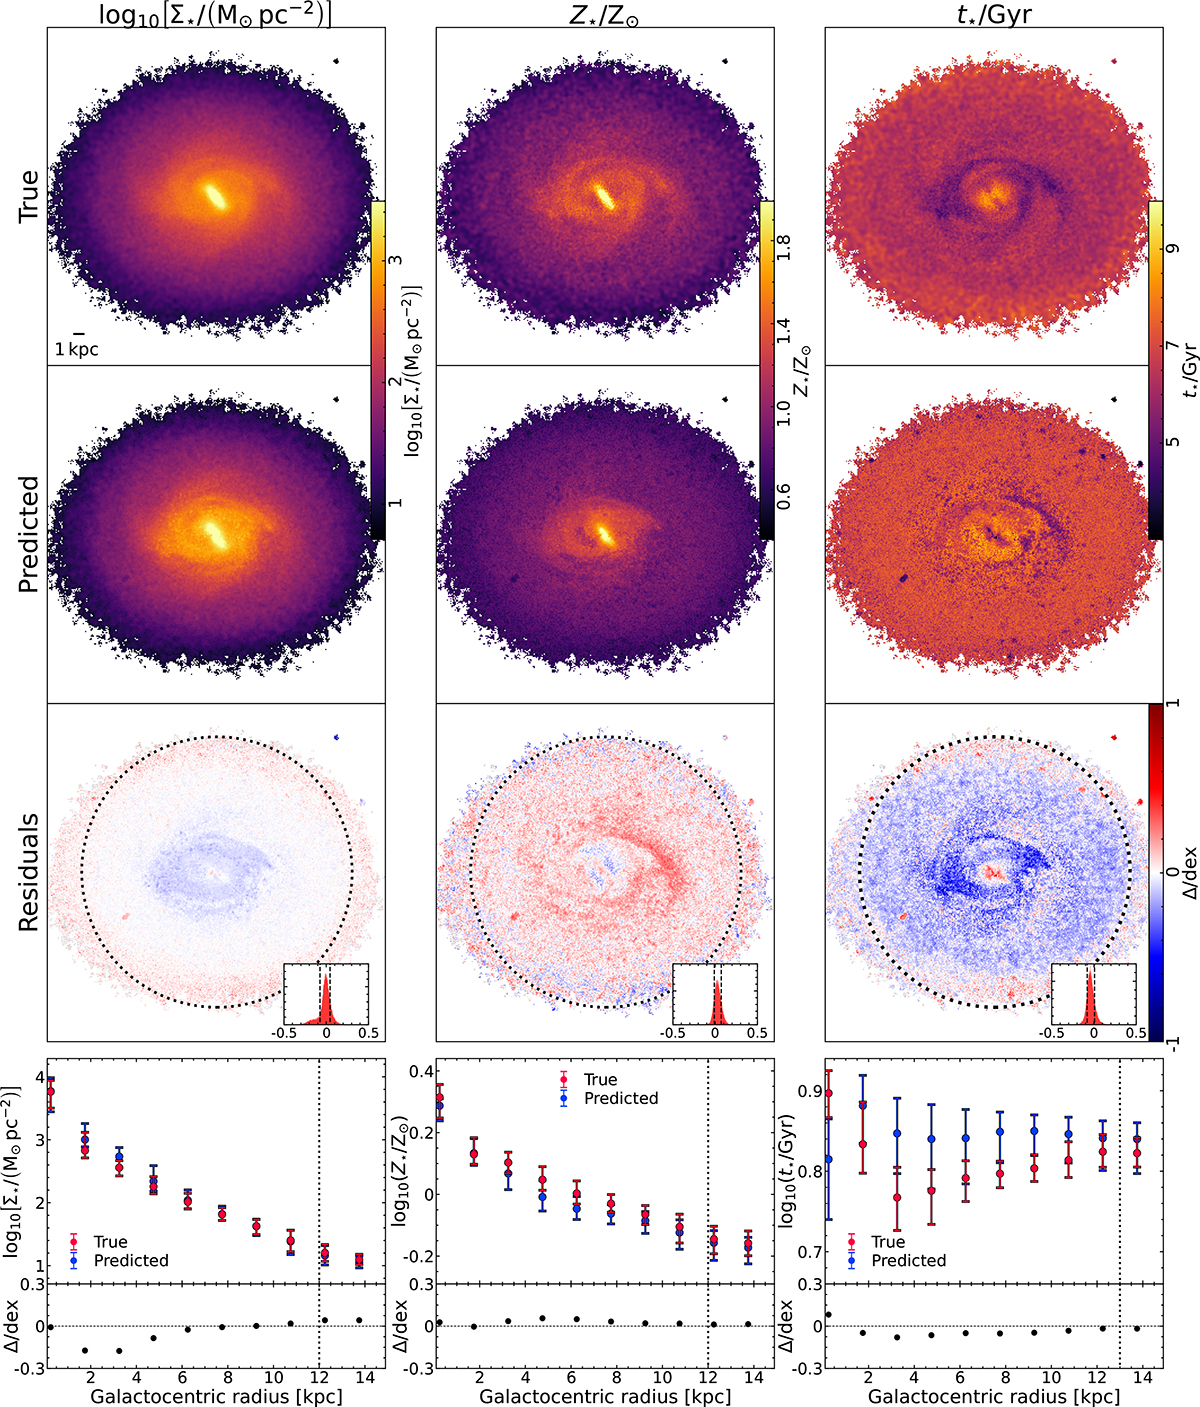
Full disc map of galaxy TNG 539333 (O5 projection) for log10[Σ⋆/(M⊙ pc−2)] (left), log10(Z⋆/Z⊙) (middle), and log10(t⋆/Gyr) (right) as an example of a more accurate model. From top to bottom: The top row shows the actual values for each property followed by the model created by a DNN algorithm on four Euclid bands, and the third row shows the residuals, where points in red (blue) represent pixels where the actual values are higher (lower) than those in the model. Histograms contained in the lower right corner of the residual maps show the distribution of error prediction (log10yi − log10
![]() , where yi is the actual i-th value, and
, where yi is the actual i-th value, and ![]() is the predicted i-th value of the pixel), dashed lines mark the 16th and 84th percentile of the distribution for the pixels contained within the dashed circle of a 12 kpc radius. Bottom row shows radial profiles for the true (red) and predicted (blue) values where large points mark the median, and error bars mark the 16th and 84th percentile of the distribution contained within the radial bin, as well as their residuals plotted underneath.
is the predicted i-th value of the pixel), dashed lines mark the 16th and 84th percentile of the distribution for the pixels contained within the dashed circle of a 12 kpc radius. Bottom row shows radial profiles for the true (red) and predicted (blue) values where large points mark the median, and error bars mark the 16th and 84th percentile of the distribution contained within the radial bin, as well as their residuals plotted underneath.
Current usage metrics show cumulative count of Article Views (full-text article views including HTML views, PDF and ePub downloads, according to the available data) and Abstracts Views on Vision4Press platform.
Data correspond to usage on the plateform after 2015. The current usage metrics is available 48-96 hours after online publication and is updated daily on week days.
Initial download of the metrics may take a while.