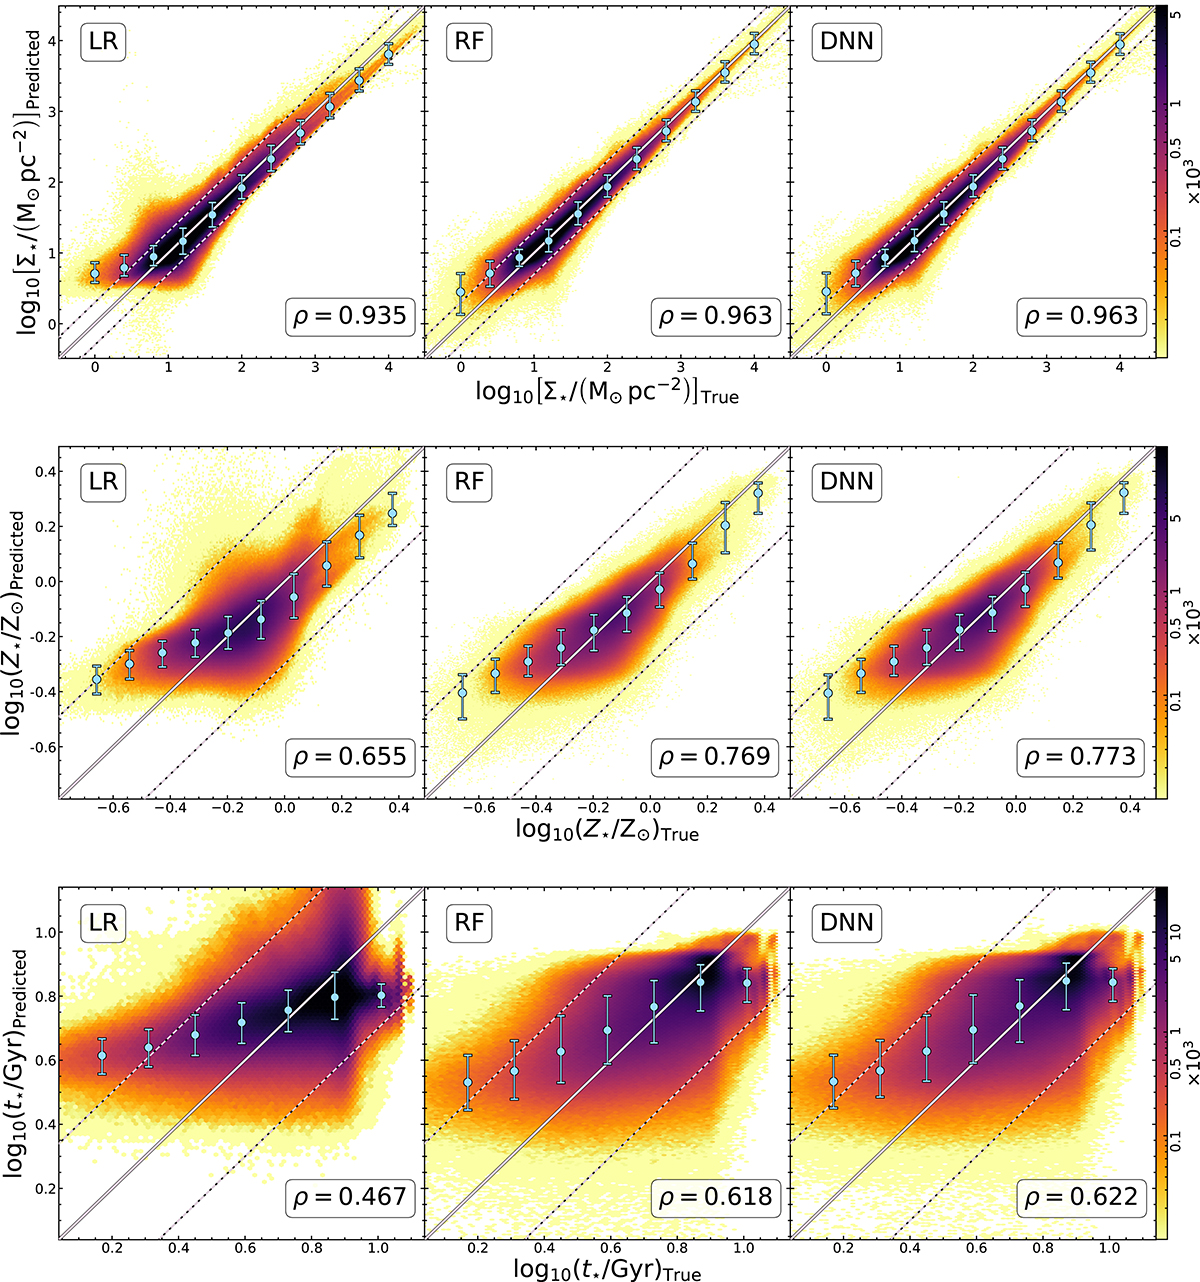
Fig. 3.
Download original image
Predictions for Σ⋆ (top), Z⋆ (middle), and t⋆ (bottom) using the four Euclid bands as the input features for the three models: linear regression (left), RF (middle), and DNN (right) as a function of their true value. A diagonal line marks the identity, and the additional two dashed lines mark the limit for the catastrophic outliers (instances where the predicted value is two times larger or smaller than the true value). Running medians, with their 16th and 84th percentiles are marked with large blue points with error bars.
Current usage metrics show cumulative count of Article Views (full-text article views including HTML views, PDF and ePub downloads, according to the available data) and Abstracts Views on Vision4Press platform.
Data correspond to usage on the plateform after 2015. The current usage metrics is available 48-96 hours after online publication and is updated daily on week days.
Initial download of the metrics may take a while.