Fig. 10.
Download original image
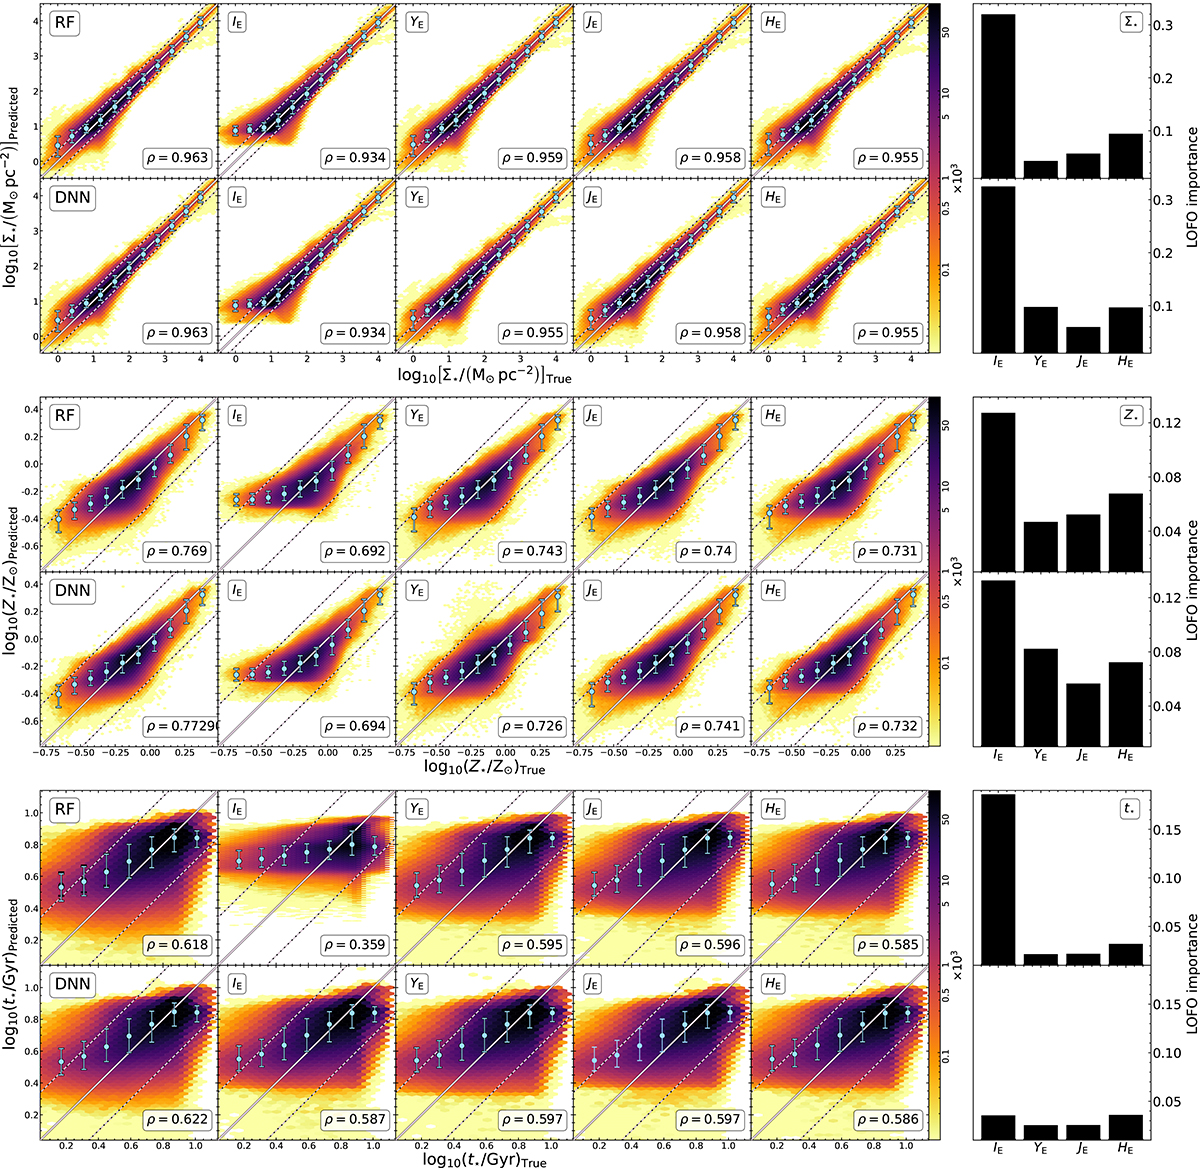
Same as Fig. 3 but for LOFO analysis. Left to right: Predicted value when all four Euclid bands are used followed by four cases where the model was trained without one of the Euclid bands (marked in the upper-left corner). The LOFO importance is shown at the far right, calculated as Eq. (11). For each of the three target values, the top row shows the case when using RF and the bottom row when using DNN.
Current usage metrics show cumulative count of Article Views (full-text article views including HTML views, PDF and ePub downloads, according to the available data) and Abstracts Views on Vision4Press platform.
Data correspond to usage on the plateform after 2015. The current usage metrics is available 48-96 hours after online publication and is updated daily on week days.
Initial download of the metrics may take a while.