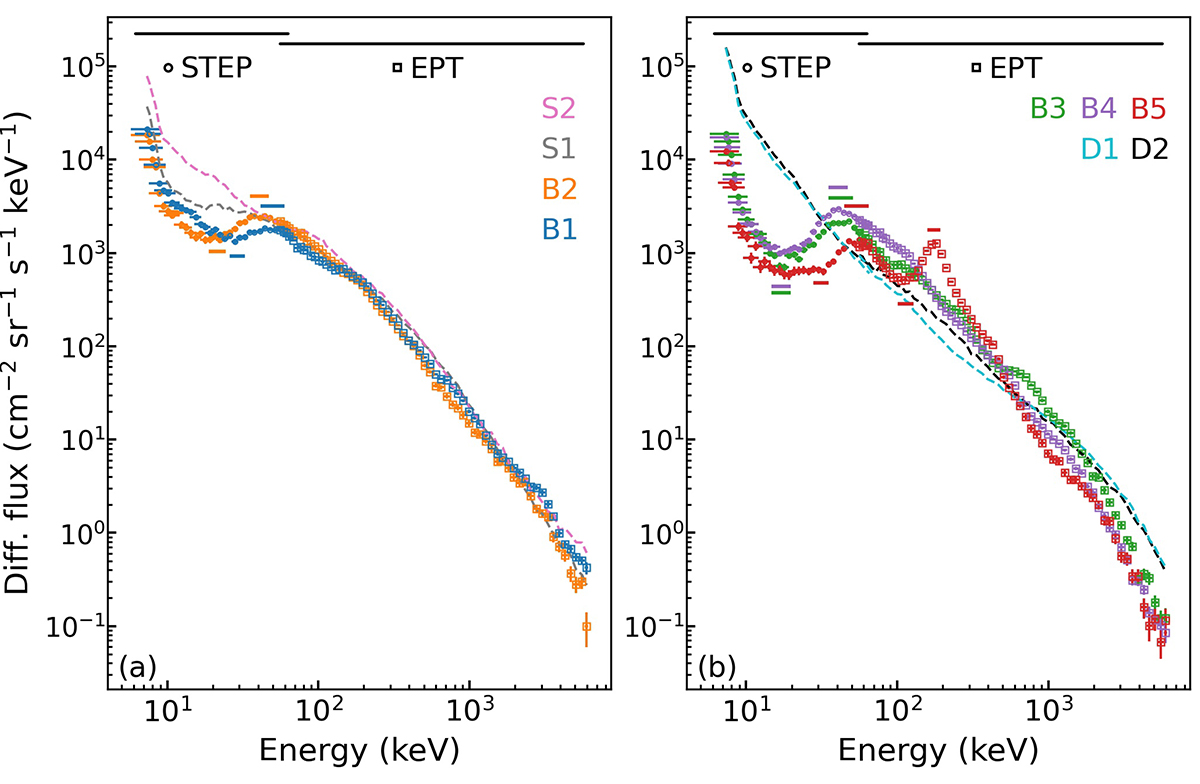
Fig. 3.
Download original image
Energy spectra averaged over the time intervals defined in Fig. 2, shown in two panels a and b for clarity. The spectra for B1 to B5 are displayed as open circles and squares, representing STEP and EPT measurements, respectively, while the spectra for S1, S2, D1, and D2 are displayed as dashed lines. The black horizontal bars at the top indicate the energy ranges covered by STEP and EPT. Other horizontal bars mark the valley and peak of the spectral bumps in corresponding colors.
Current usage metrics show cumulative count of Article Views (full-text article views including HTML views, PDF and ePub downloads, according to the available data) and Abstracts Views on Vision4Press platform.
Data correspond to usage on the plateform after 2015. The current usage metrics is available 48-96 hours after online publication and is updated daily on week days.
Initial download of the metrics may take a while.