Fig. 1.
Download original image
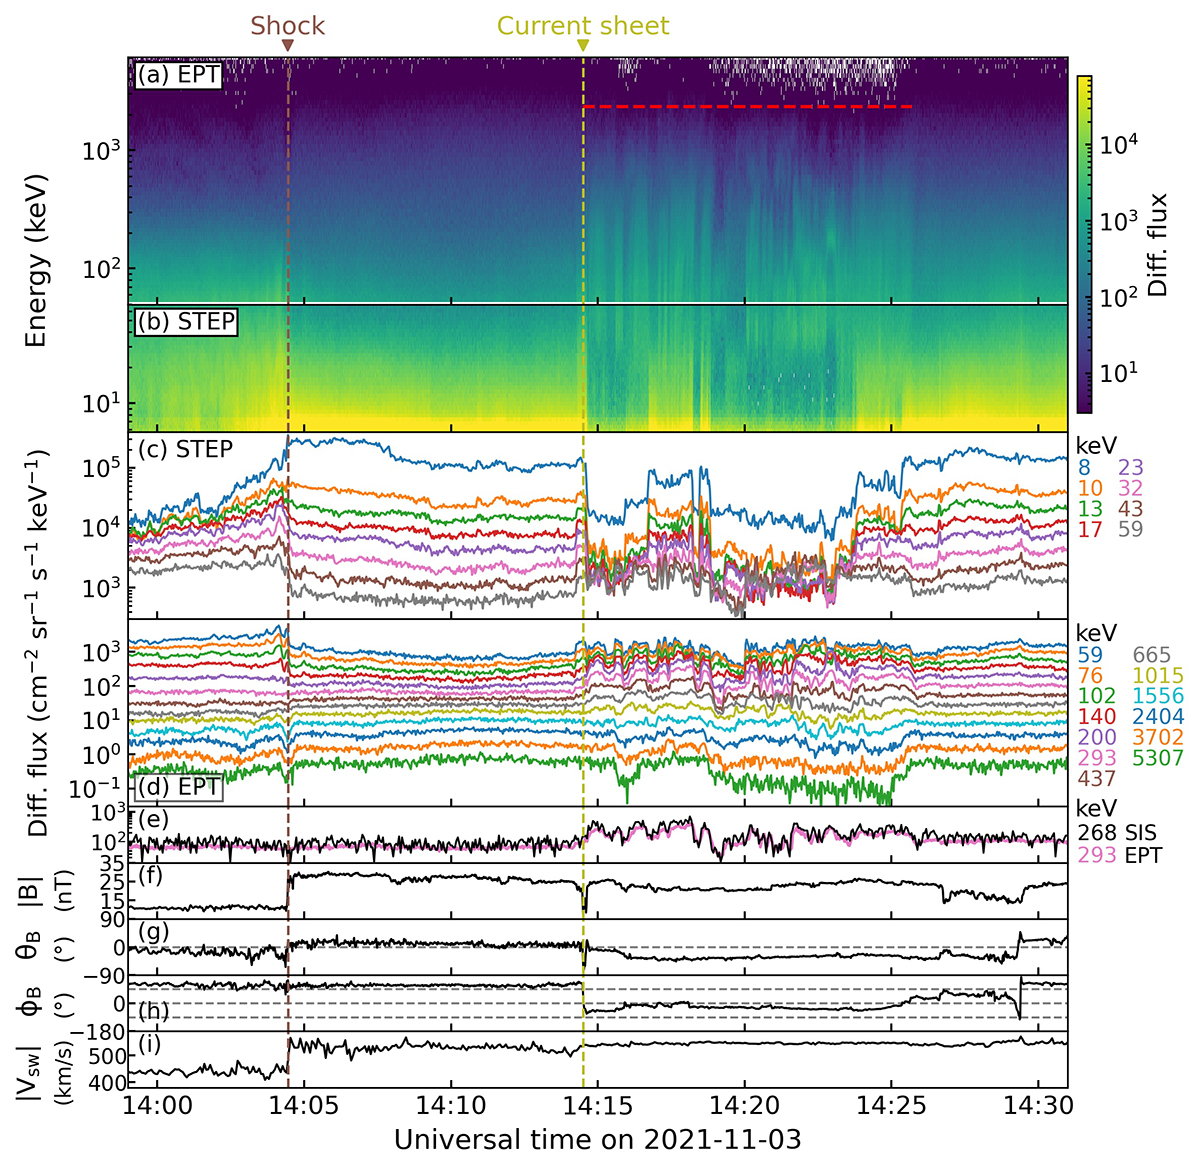
Overview plot of the 2021 November 3 shock event. (a)–(b) Spectrograms of dynamic energy spectra measured by EPT’s sunward telescope (a) and STEP’s central 9 pixels (b). The horizontal dashed red line indicates the time interval during which proton bursts are observed. (c)–(d) Line profiles corresponding to the spectrograms in (a)–(b), respectively. STEP’s 32 energy bins and EPT’s 64 energy bins are grouped into 10 and 13 bins, respectively, with their central energies labeled on the right of the panels. (e) Temporal flux profiles of ∼268 keV protons measured by SIS’s sunward telescope (black) and ∼293 keV protons measured by EPT’s sunward telescope (pink). (f)–(h) Magnitude |B|, elevation angle θB, and azimuthal angle ϕB of the IMF. (i) Solar wind proton bulk speed |Vsw|. The IMF and solar wind speed are measured in the spacecraft frame. The dashed brown line marks the shock arrival, and the dashed yellow line marks the current sheet crossing.
Current usage metrics show cumulative count of Article Views (full-text article views including HTML views, PDF and ePub downloads, according to the available data) and Abstracts Views on Vision4Press platform.
Data correspond to usage on the plateform after 2015. The current usage metrics is available 48-96 hours after online publication and is updated daily on week days.
Initial download of the metrics may take a while.