Fig. 8
Download original image
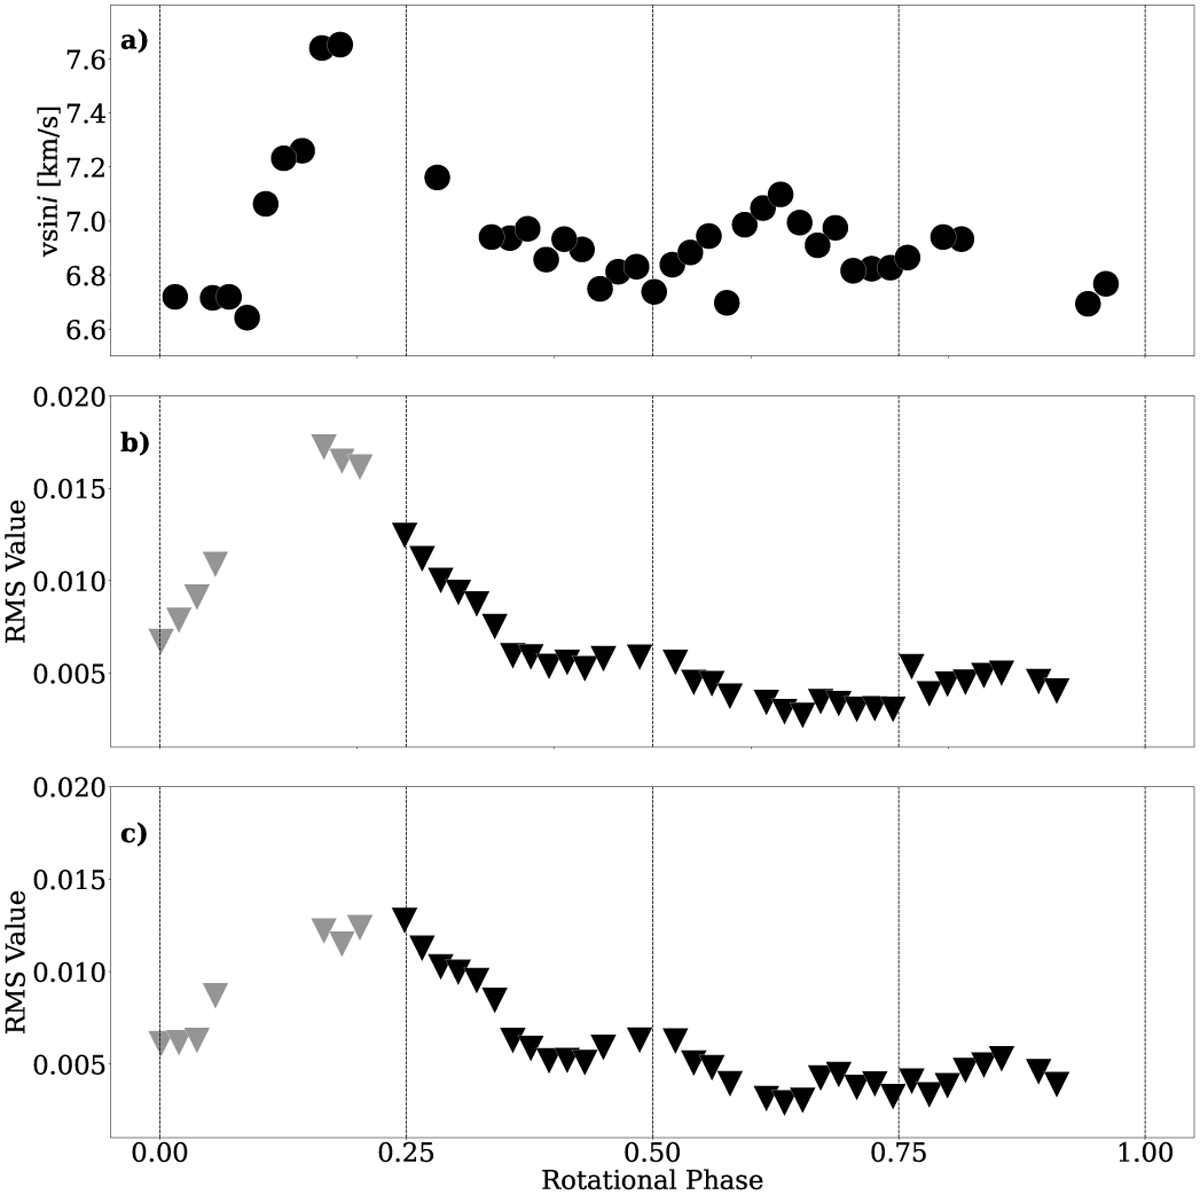
Line broadening and RMS residuals from Doppler imaging. Panel a: individual v sin i measures obtained from ParSES. Panel b: RMS values of the SVD profiles from the initial Doppler imaging. Panel c: same as panel b but after applying a variable macroturbulence broadening for the first seven phases. The grey markers indicate the seven phases where this was done.
Current usage metrics show cumulative count of Article Views (full-text article views including HTML views, PDF and ePub downloads, according to the available data) and Abstracts Views on Vision4Press platform.
Data correspond to usage on the plateform after 2015. The current usage metrics is available 48-96 hours after online publication and is updated daily on week days.
Initial download of the metrics may take a while.