Open Access
Fig. 3
Download original image
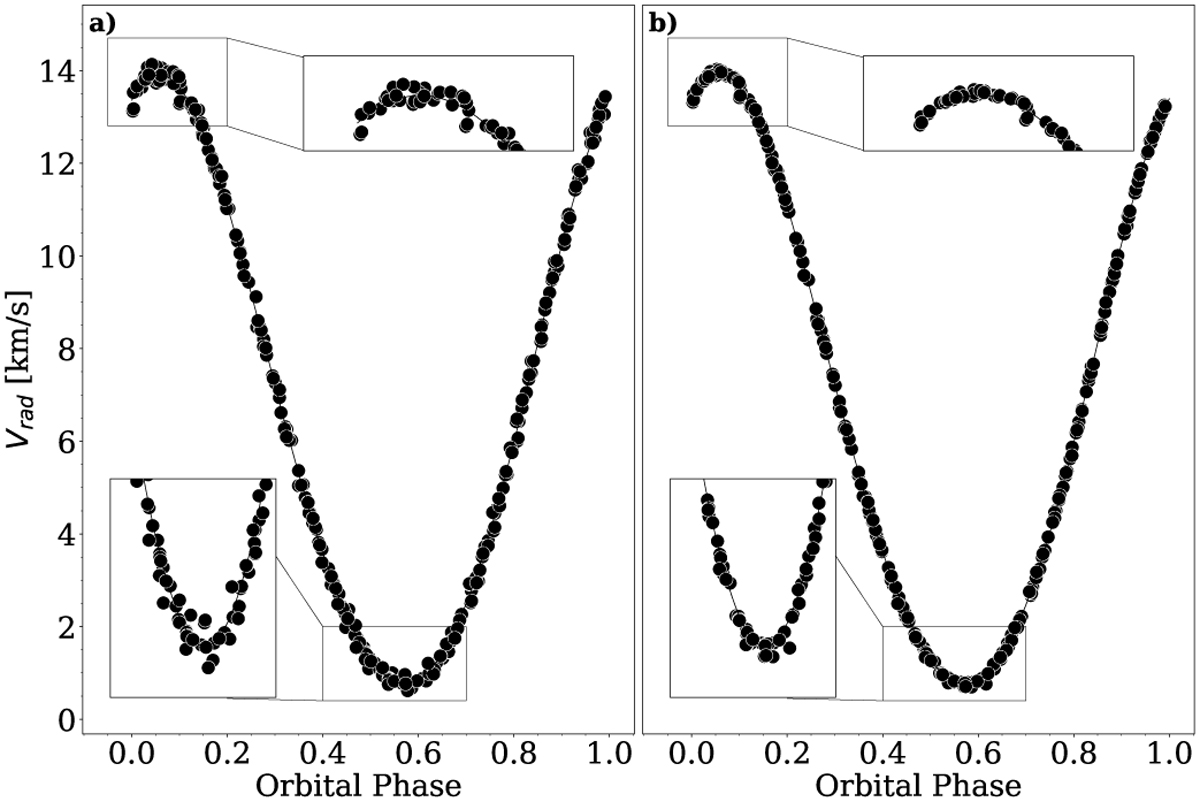
Phase folded RV curves for λ And. a: before removing the spot signal and b: after removing the spot signal. The maximum and minimum RV regions are enlarged for better viewing. The overall RMS decreased by a factor two.
Current usage metrics show cumulative count of Article Views (full-text article views including HTML views, PDF and ePub downloads, according to the available data) and Abstracts Views on Vision4Press platform.
Data correspond to usage on the plateform after 2015. The current usage metrics is available 48-96 hours after online publication and is updated daily on week days.
Initial download of the metrics may take a while.