Fig. B.3
Download original image
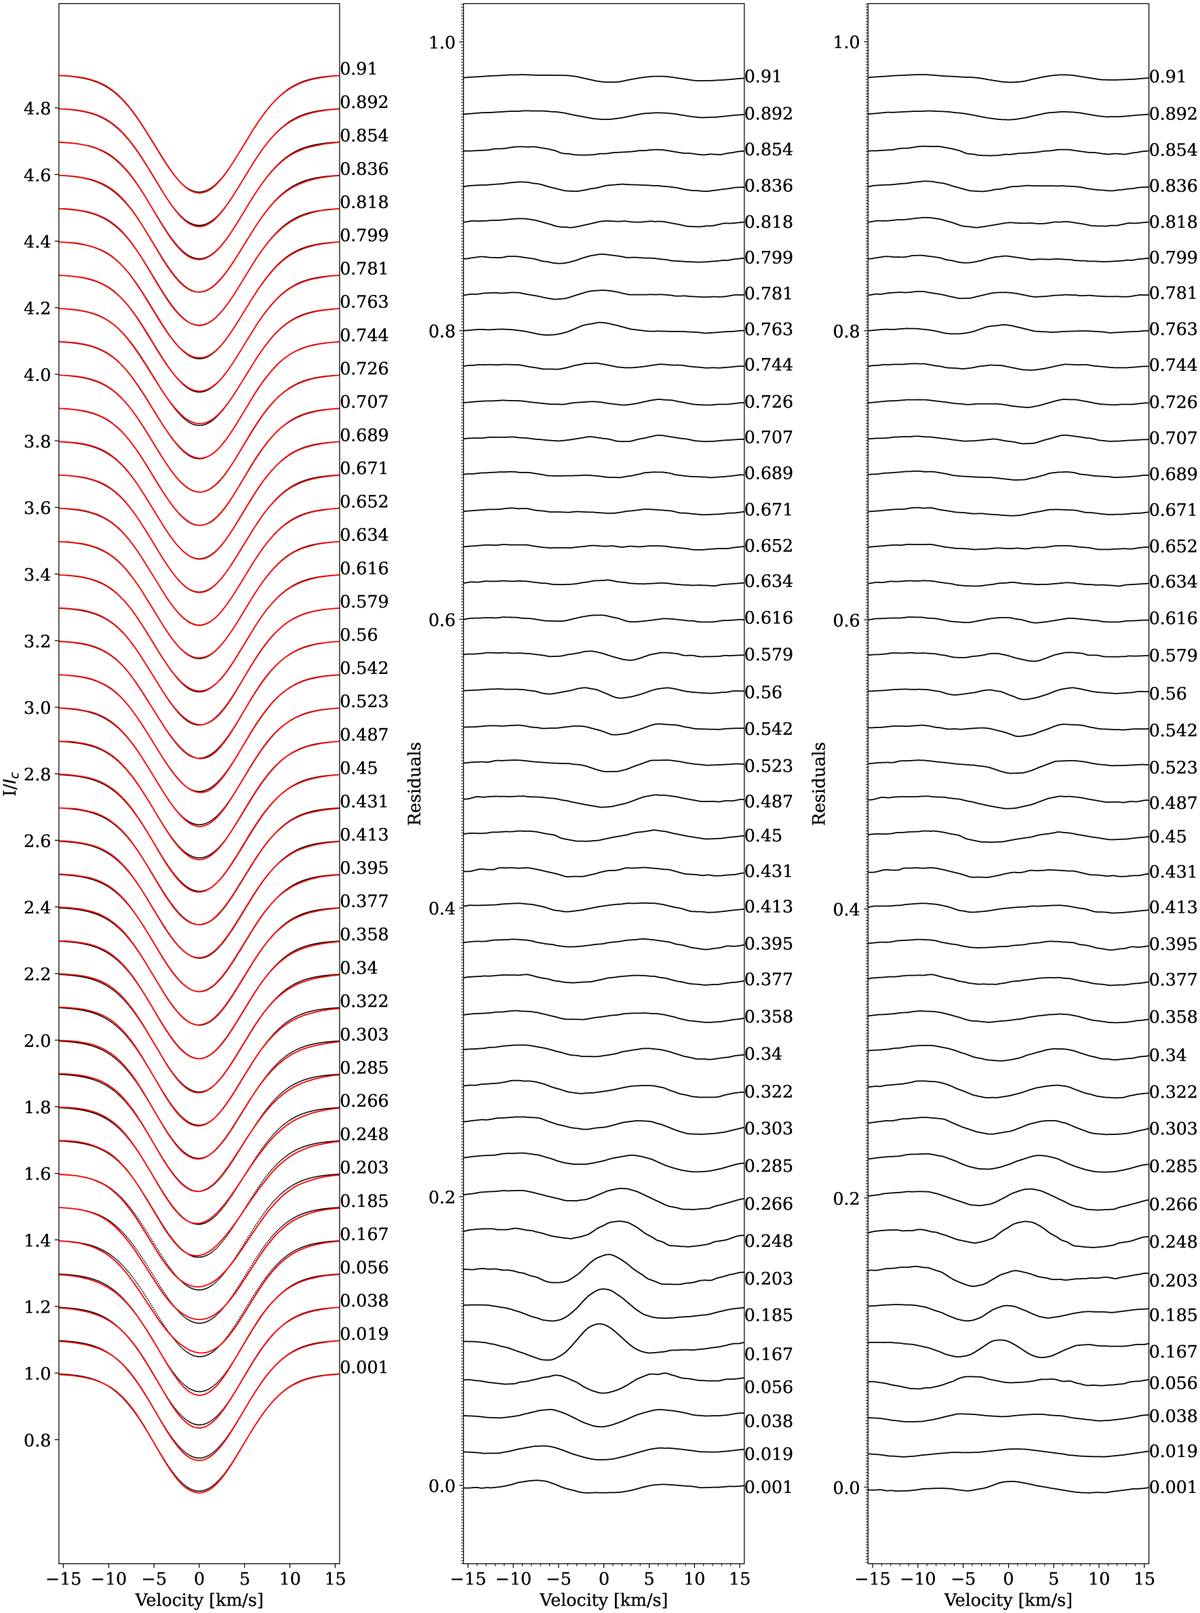
Singular value decomposition line profile fits from iMAP. Left panel: Observed line profiles (red line) and synthetic profiles (black dotted lines). Middle panel: Residuals from the iMAP fits with a single fixed macro turbulence. Right panel: Residuals when a macro turbulence change is applied to the first seven phases (see text). Numbers on the right side of each panel indicate the rotational phase.
Current usage metrics show cumulative count of Article Views (full-text article views including HTML views, PDF and ePub downloads, according to the available data) and Abstracts Views on Vision4Press platform.
Data correspond to usage on the plateform after 2015. The current usage metrics is available 48-96 hours after online publication and is updated daily on week days.
Initial download of the metrics may take a while.