Fig. 10
Download original image
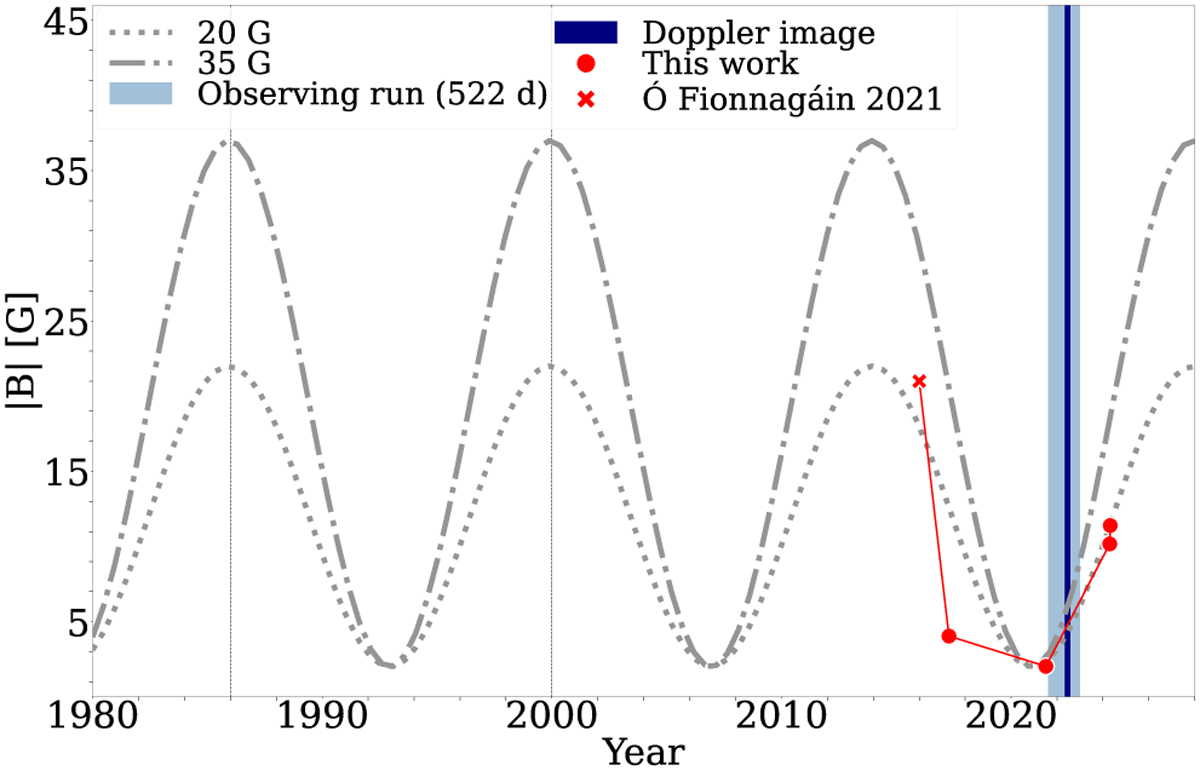
Long-term magnetic field measurements (shown in red symbols) and possible cyclic changes. A likely cycle period of 14 years from photometry (Mirtorabi et al. 2003) from 1976–2002 was adopted. They identified two activity peaks in 1986 and 2000 (indicated with two vertical lines). Two versions of an assumed sinusoidal variation with a maximum amplitude of |B| of 20 and 35 G are shown. The respective minimum value was set to 2 G which is the minimum of the measured absolute magnetic flux in 2022. Our field measurements coincided with a time of activity minimum.
Current usage metrics show cumulative count of Article Views (full-text article views including HTML views, PDF and ePub downloads, according to the available data) and Abstracts Views on Vision4Press platform.
Data correspond to usage on the plateform after 2015. The current usage metrics is available 48-96 hours after online publication and is updated daily on week days.
Initial download of the metrics may take a while.