Fig. 1
Download original image
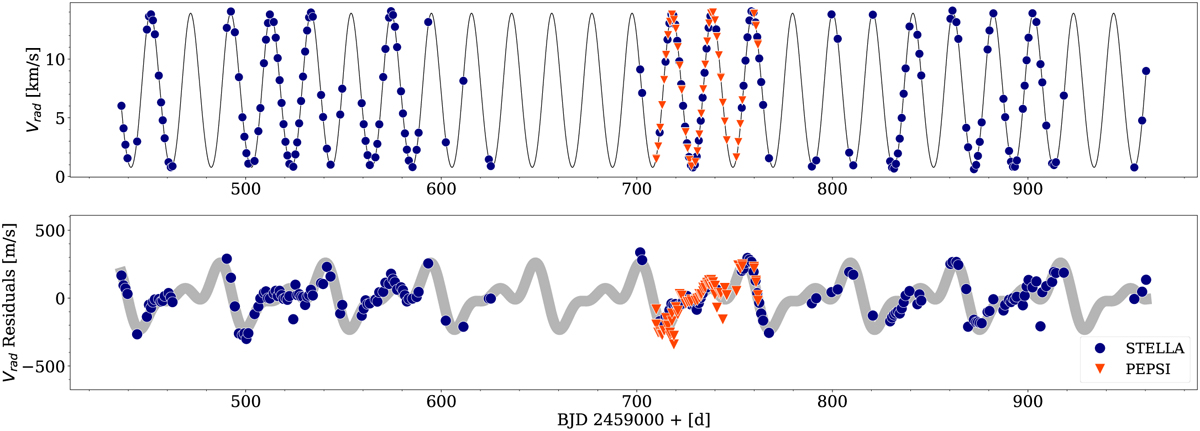
Radial velocities of λ And from STELLA+SES and VATT+PEPSI. In the upper panel, the orbital fit is plotted as a black line along with the data. STELLA+SES observations are indicated with dark blue circles; VATT+PEPSI observations are plotted in red triangles. In the lower panel the RV residuals are shown after removing the predicted orbital velocities. The thick grey line emphasizes the rotational modulation by applying a three-sinusoidal fit to the RV residuals.
Current usage metrics show cumulative count of Article Views (full-text article views including HTML views, PDF and ePub downloads, according to the available data) and Abstracts Views on Vision4Press platform.
Data correspond to usage on the plateform after 2015. The current usage metrics is available 48-96 hours after online publication and is updated daily on week days.
Initial download of the metrics may take a while.