Open Access
Fig. 9.
Download original image
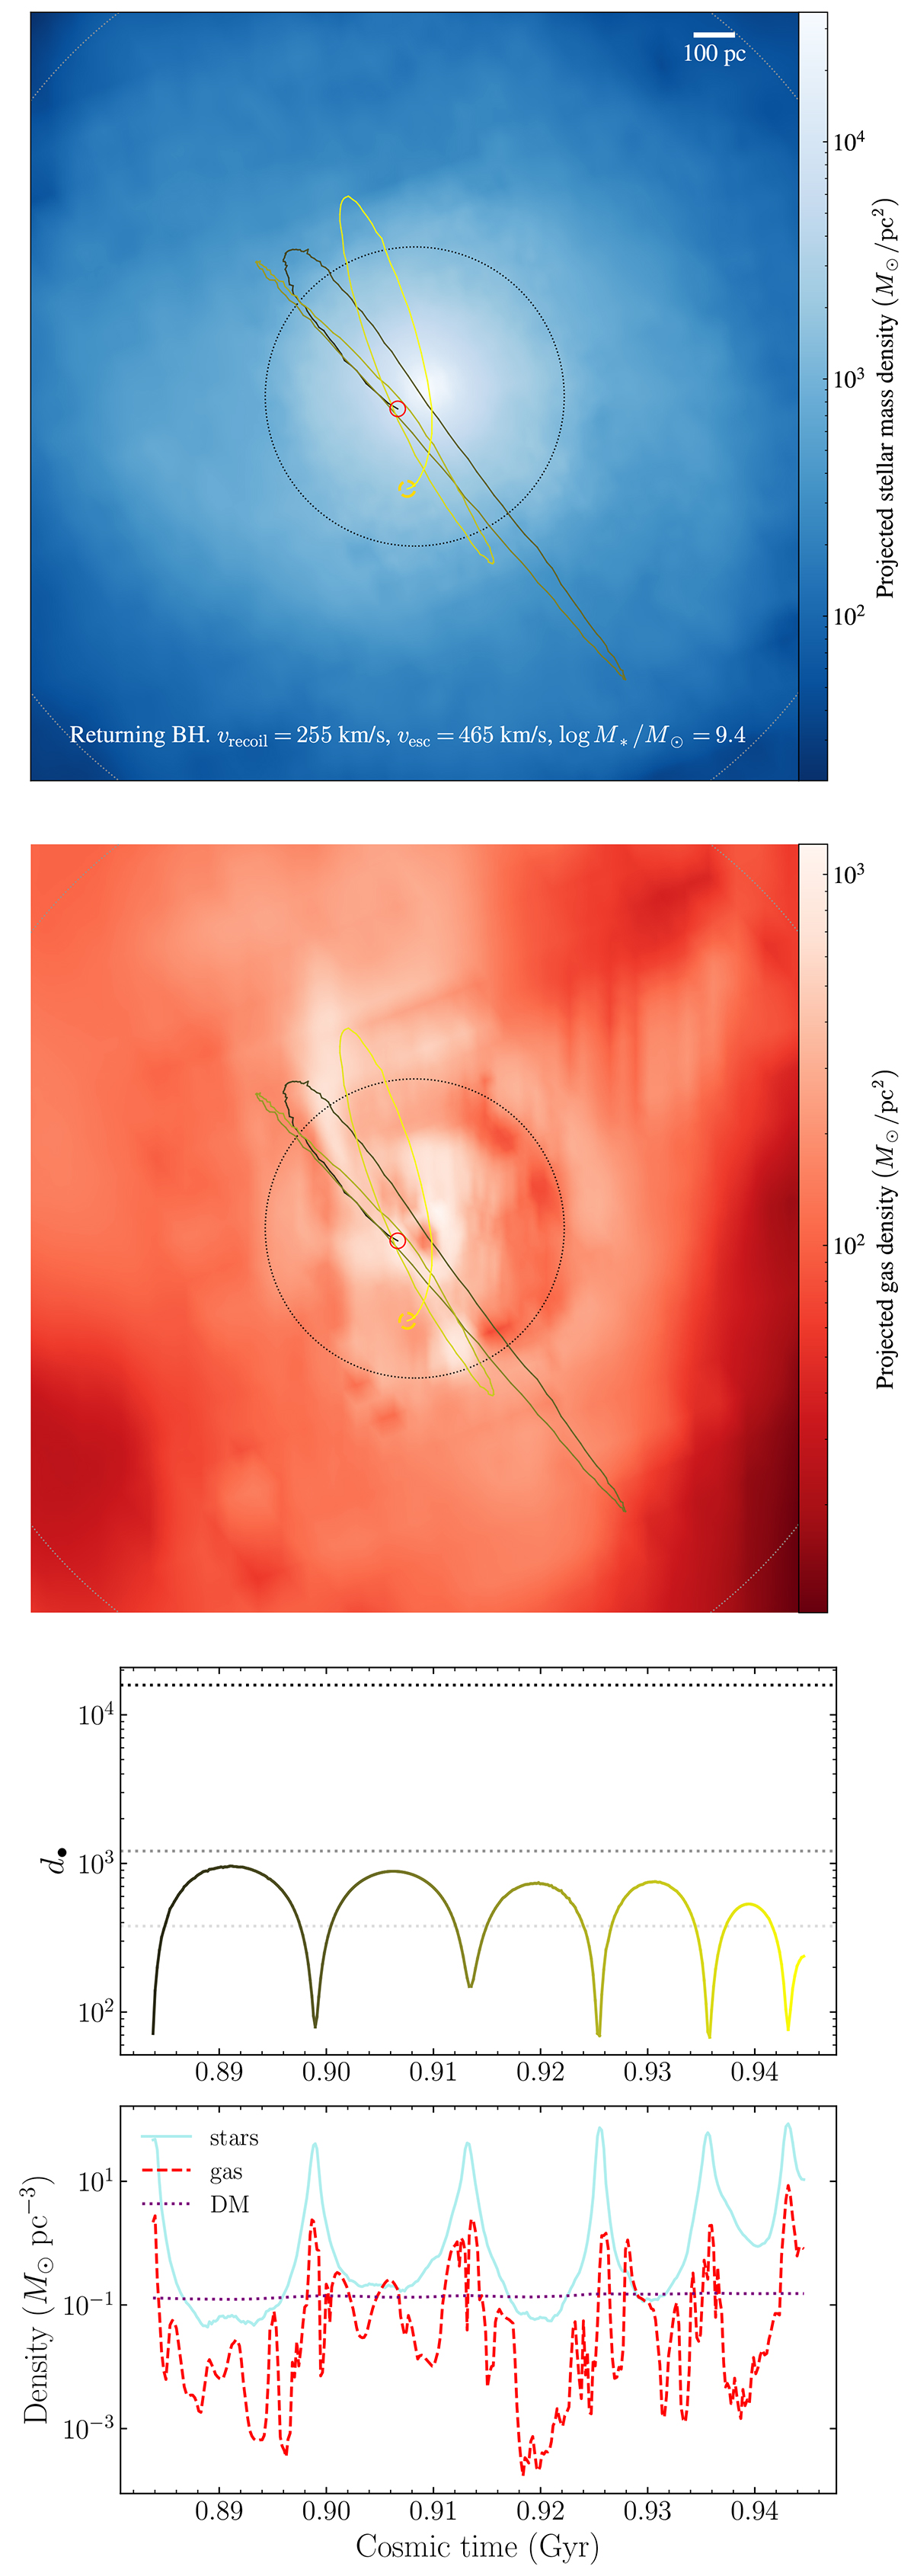
Trajectory of a returning MBH, plotted against the projected stellar and gas density (top and middle panels). The colour lightens with time. The bottom panels show the distance to the centre and the density of stars, gas and DM along the trajectory. Light grey, grey, black dotted horizontal lines denote R50, R90, Rvir.
Current usage metrics show cumulative count of Article Views (full-text article views including HTML views, PDF and ePub downloads, according to the available data) and Abstracts Views on Vision4Press platform.
Data correspond to usage on the plateform after 2015. The current usage metrics is available 48-96 hours after online publication and is updated daily on week days.
Initial download of the metrics may take a while.