Fig. 7
Download original image
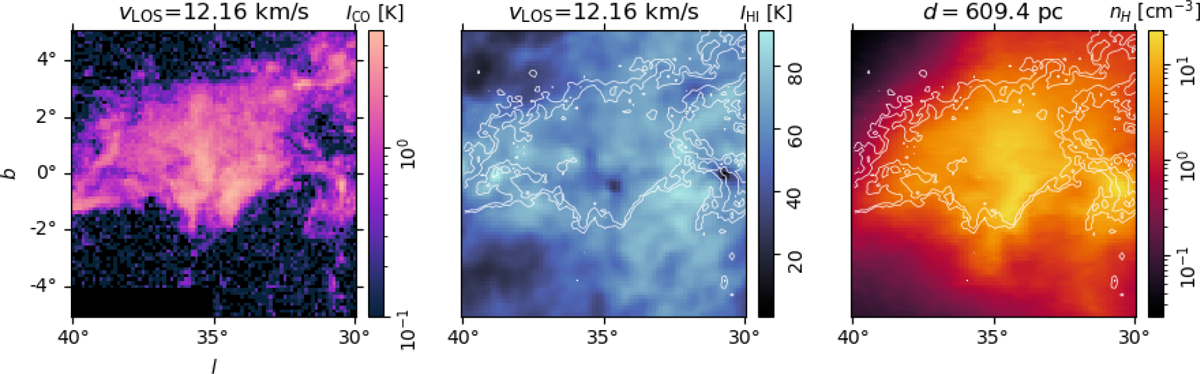
Example of the distance and CO velocity channel with high morphological correlation. It corresponds to the highest Vd in the comparison between the CO line emission and the 3D dust presented in the right panel of Fig. 5. From left to right, the panels show the CO and H I line emission at the indicated vLOS and the nucleon density inferred from the 3 D dust model at the corresponding distance.
Current usage metrics show cumulative count of Article Views (full-text article views including HTML views, PDF and ePub downloads, according to the available data) and Abstracts Views on Vision4Press platform.
Data correspond to usage on the plateform after 2015. The current usage metrics is available 48-96 hours after online publication and is updated daily on week days.
Initial download of the metrics may take a while.