Fig. 6
Download original image
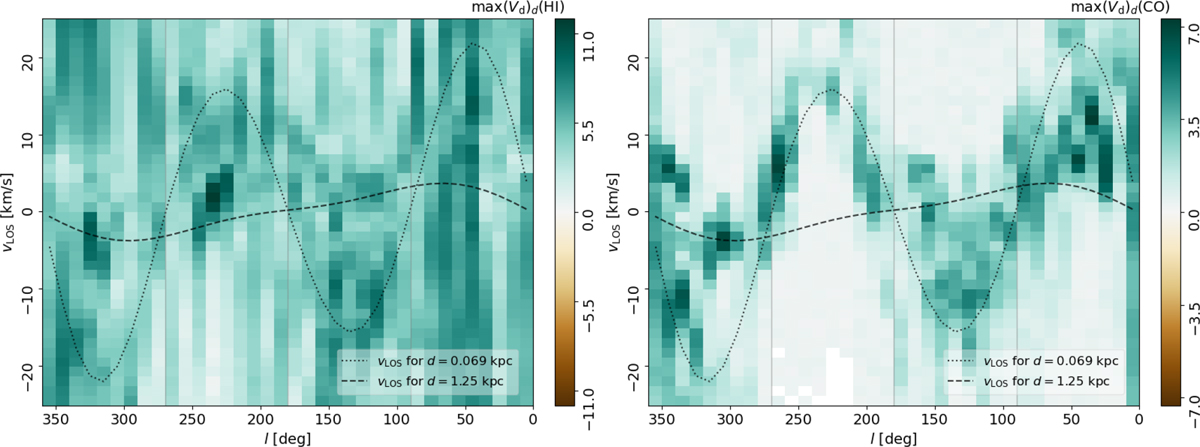
Maximum morphological correlation between the 10° × 10° LOS velocity channels and the dust density in the range 69 < d < 1250 pc, as quantified by the direction-sensitive projected Rayleigh statistic (Vd; Eq. (2)). The cyan curves represent the vLOS expected for d = 69 and 1250 pc according to the Reid et al. (2019) Galactic rotation model, shown by dotted and dashed lines, respectively.
Current usage metrics show cumulative count of Article Views (full-text article views including HTML views, PDF and ePub downloads, according to the available data) and Abstracts Views on Vision4Press platform.
Data correspond to usage on the plateform after 2015. The current usage metrics is available 48-96 hours after online publication and is updated daily on week days.
Initial download of the metrics may take a while.