Open Access
Fig. C.1
Download original image
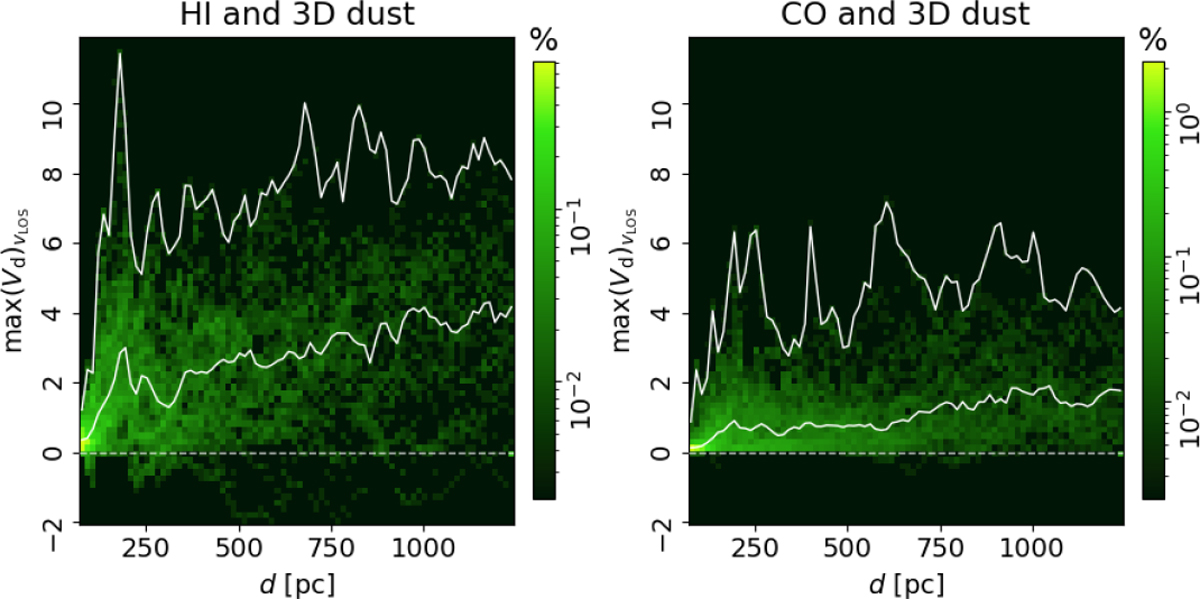
Two-dimensional histograms showing the distribution of Vd and distances for the data presented in Fig. 5. The solid white lines correspond to the 50th and 99th percentile of the max(Vd) values in each distance bin.
Current usage metrics show cumulative count of Article Views (full-text article views including HTML views, PDF and ePub downloads, according to the available data) and Abstracts Views on Vision4Press platform.
Data correspond to usage on the plateform after 2015. The current usage metrics is available 48-96 hours after online publication and is updated daily on week days.
Initial download of the metrics may take a while.