Open Access
Fig. A.3
Download original image
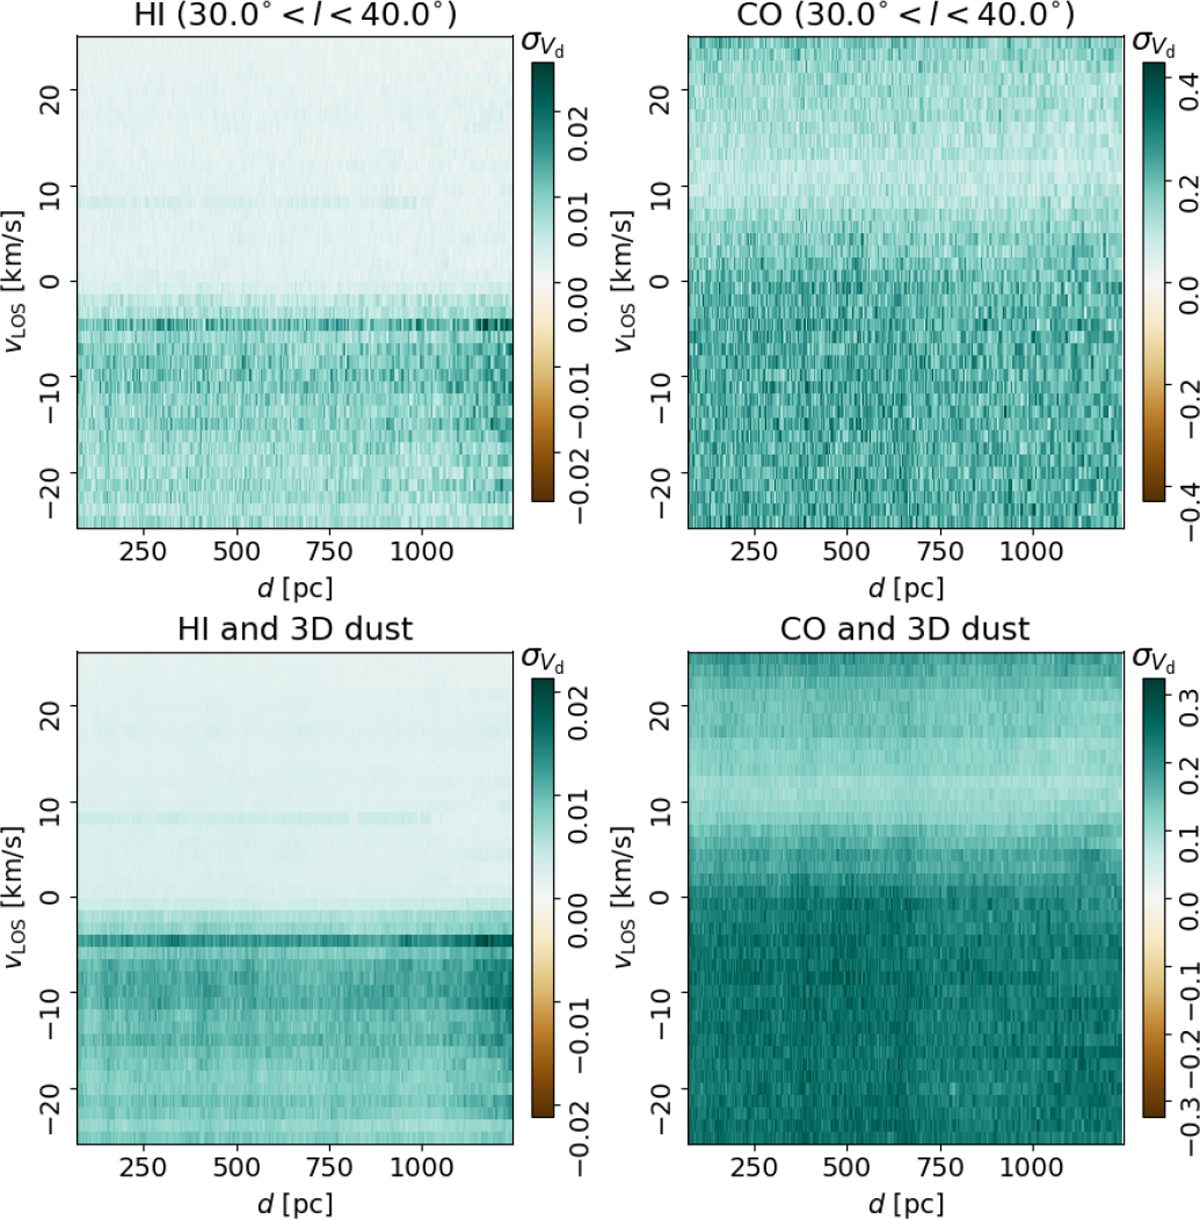
Standard deviation of Vd obtained for the comparison between the mean 3D dust cube and the Monte Carlo sampling of the line emission observations with for NMC = 10 and 100 , shown in the top and bottom panels respectively.
Current usage metrics show cumulative count of Article Views (full-text article views including HTML views, PDF and ePub downloads, according to the available data) and Abstracts Views on Vision4Press platform.
Data correspond to usage on the plateform after 2015. The current usage metrics is available 48-96 hours after online publication and is updated daily on week days.
Initial download of the metrics may take a while.