Fig. 14
Download original image
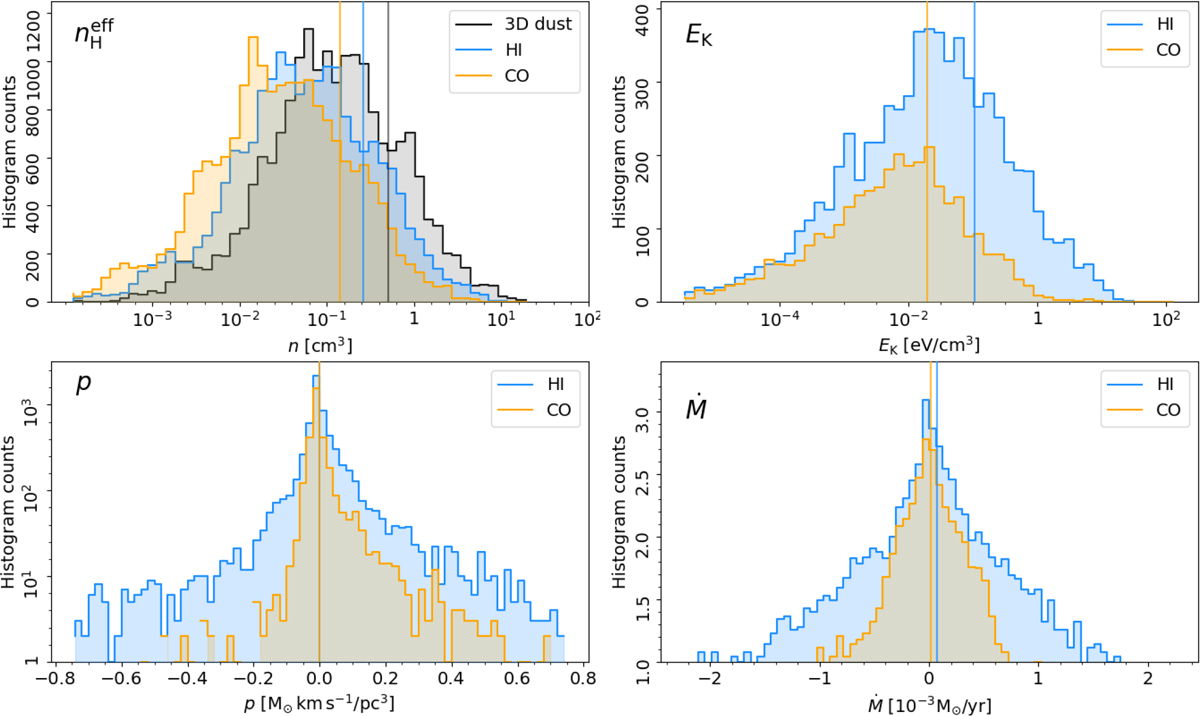
Histograms of the physical quantities derived from the HOG analysis. Top left: Effective energy density, neff, that is assigned to each gas tracer, as defined in Eq. (3). Top right: Kinetic energy density, Ek, calculated with Eq. (5). Bottom left: Radial momentum, p, calculated with Eq. (7). Bottom right: Mass flow rate, ![]() , calculated with Eq. (8).
, calculated with Eq. (8).
Current usage metrics show cumulative count of Article Views (full-text article views including HTML views, PDF and ePub downloads, according to the available data) and Abstracts Views on Vision4Press platform.
Data correspond to usage on the plateform after 2015. The current usage metrics is available 48-96 hours after online publication and is updated daily on week days.
Initial download of the metrics may take a while.