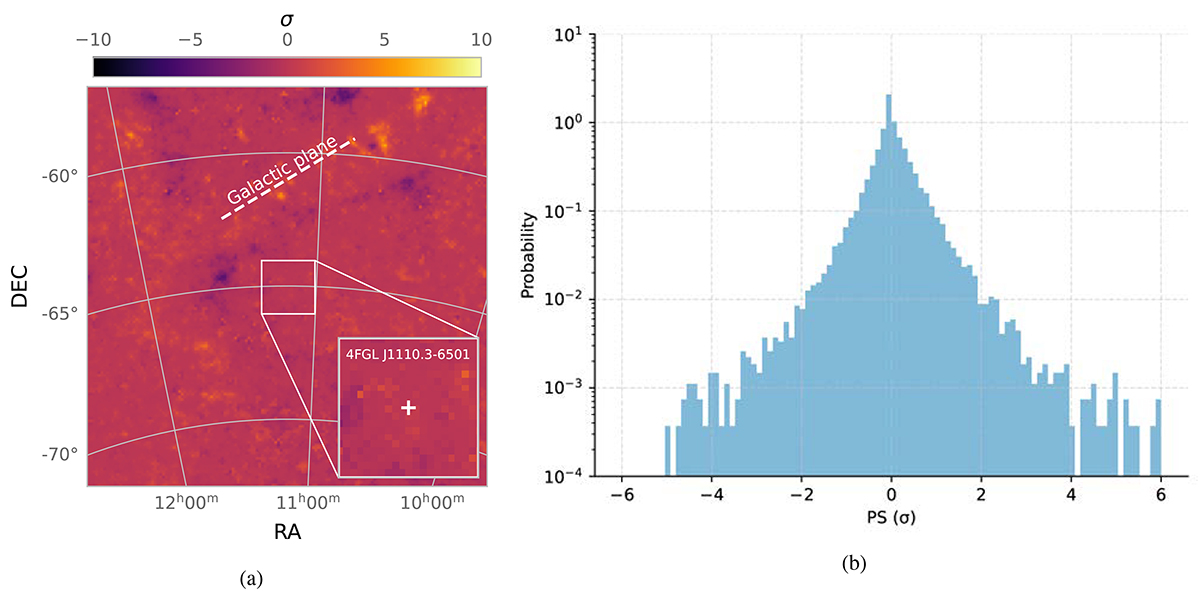
Fig. 4.
Download original image
Left panel: PS map of the RoI. The gradient represents positive and negative residuals in the RoI, rescaled in terms of statistical significance according to the definition in Bruel (2021). Negative values imply an overestimation of the background. The Galactic plane is highlighted with a dashed line. In the inset, the white cross shows the position of our source, included in the model and therefore blended with the background. Right panel: histogram of the PS values in units of standard deviations, derived from the joint weighted likelihood fit that includes the source under examination in the spectral model. Negative values correspond to areas where the model overestimates the background, and positive values areas where the model underestimates it.
Current usage metrics show cumulative count of Article Views (full-text article views including HTML views, PDF and ePub downloads, according to the available data) and Abstracts Views on Vision4Press platform.
Data correspond to usage on the plateform after 2015. The current usage metrics is available 48-96 hours after online publication and is updated daily on week days.
Initial download of the metrics may take a while.