Fig. 3.
Download original image
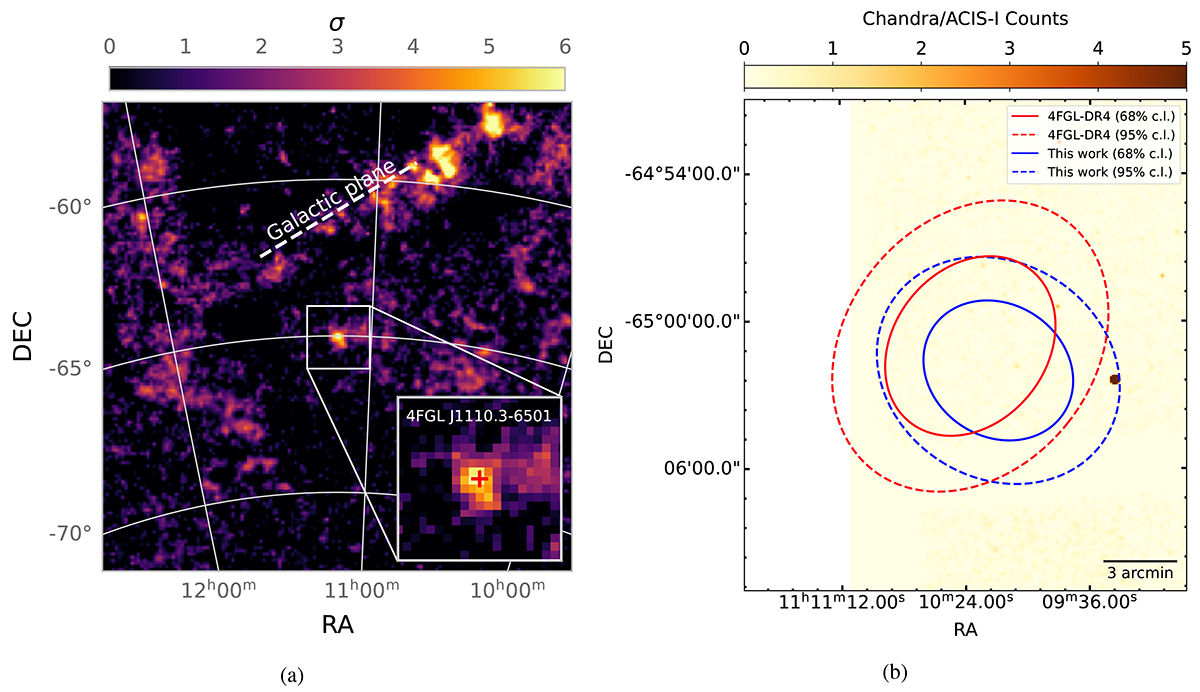
Left: TS map of the RoI. Regions with significant, un-modelled contributions are shown in brighter colours. The dashed line indicates the position of the Galactic plane. Our source, located in the centre of the RoI, is shown as a yellow spot, as depicted in the inset. Right: comparison of our source localisation with the previous Fermi 4FGL-DR4 catalogue position, overlaid on the Chandra X-ray image. The catalogue position is shown with red ellipses and the position from our study in blue. The solid ellipses indicate the 68% c.l. and the dashed ellipses the 95% c.l. The Chandra source CXOU J110926.4–650224, depicted as the dark spot, lies within the 95% c.l. contour, consistent with our localisation of the Fermi source.
Current usage metrics show cumulative count of Article Views (full-text article views including HTML views, PDF and ePub downloads, according to the available data) and Abstracts Views on Vision4Press platform.
Data correspond to usage on the plateform after 2015. The current usage metrics is available 48-96 hours after online publication and is updated daily on week days.
Initial download of the metrics may take a while.