Fig. 2.
Download original image
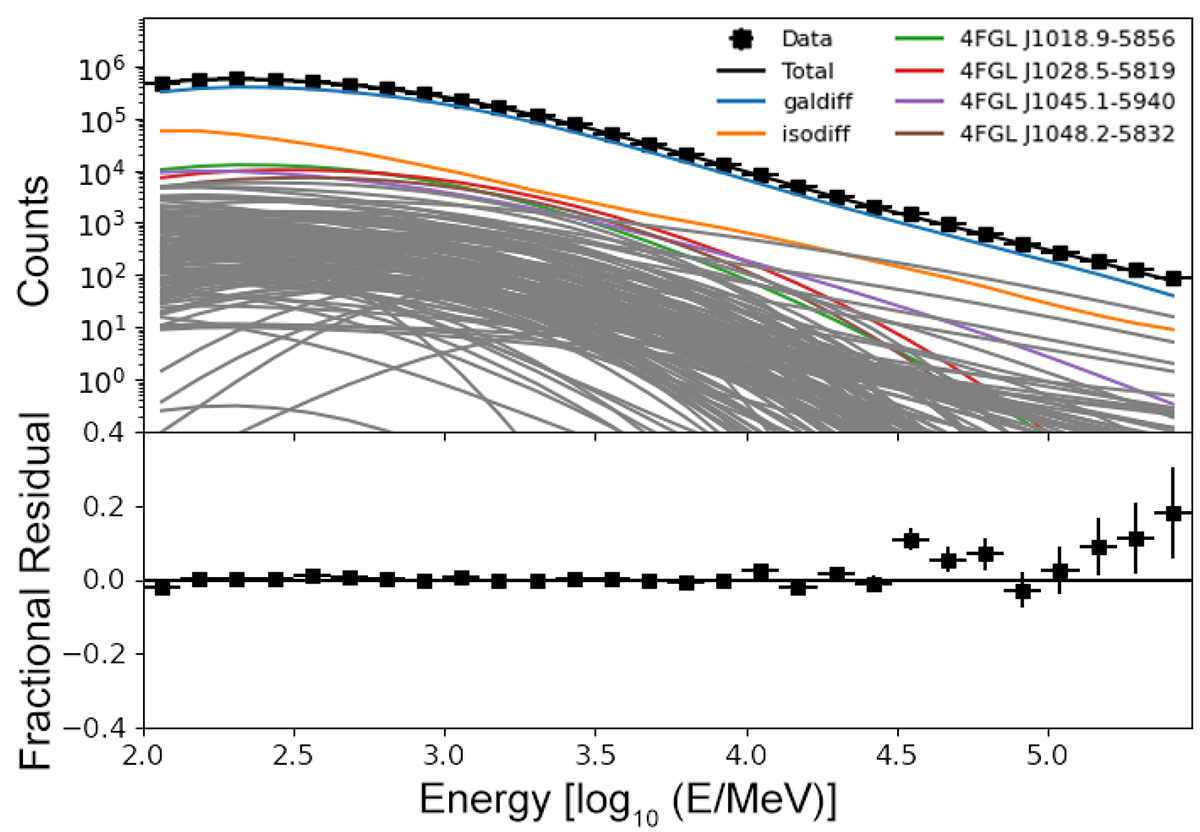
Count spectrum and residuals resulting from the likelihood fit of the data within the considered RoI. The fit was performed using a total of 184 sources (see the text for details). The black line represents the total model, where the predominant component is the Galactic diffuse emission (in azure), followed by the isotropic background gamma-ray emission component (in orange). Some of the brightest sources in our RoI are also highlighted.
Current usage metrics show cumulative count of Article Views (full-text article views including HTML views, PDF and ePub downloads, according to the available data) and Abstracts Views on Vision4Press platform.
Data correspond to usage on the plateform after 2015. The current usage metrics is available 48-96 hours after online publication and is updated daily on week days.
Initial download of the metrics may take a while.