Open Access
Fig. 8.
Download original image
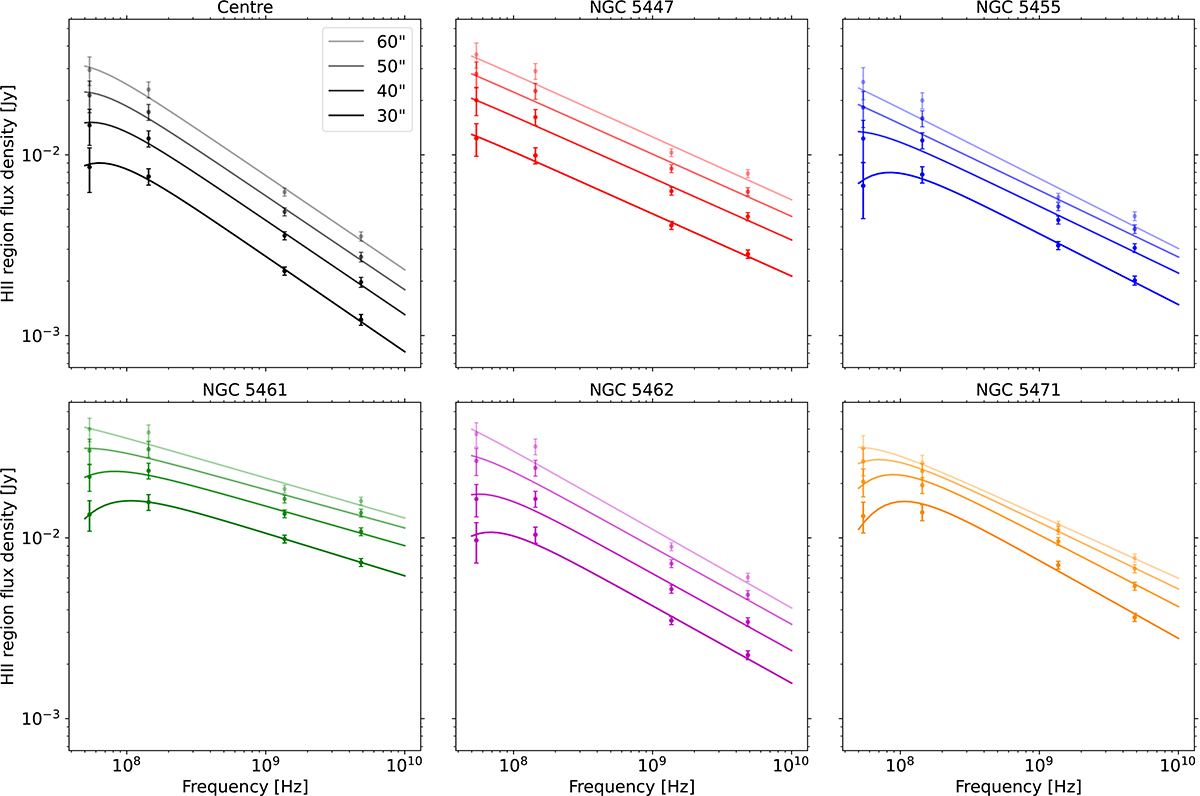
Spectra of the selected H II regions in M 101. The solid lines of different opacity correspond to fits for the free–free absorption model (combined Eq. (1) and (2)) in different areas within which the flux is measured, with diameters from 30 to 60″ with a 10″ step. The fit parameters for the 30″ area are in Table 4.
Current usage metrics show cumulative count of Article Views (full-text article views including HTML views, PDF and ePub downloads, according to the available data) and Abstracts Views on Vision4Press platform.
Data correspond to usage on the plateform after 2015. The current usage metrics is available 48-96 hours after online publication and is updated daily on week days.
Initial download of the metrics may take a while.