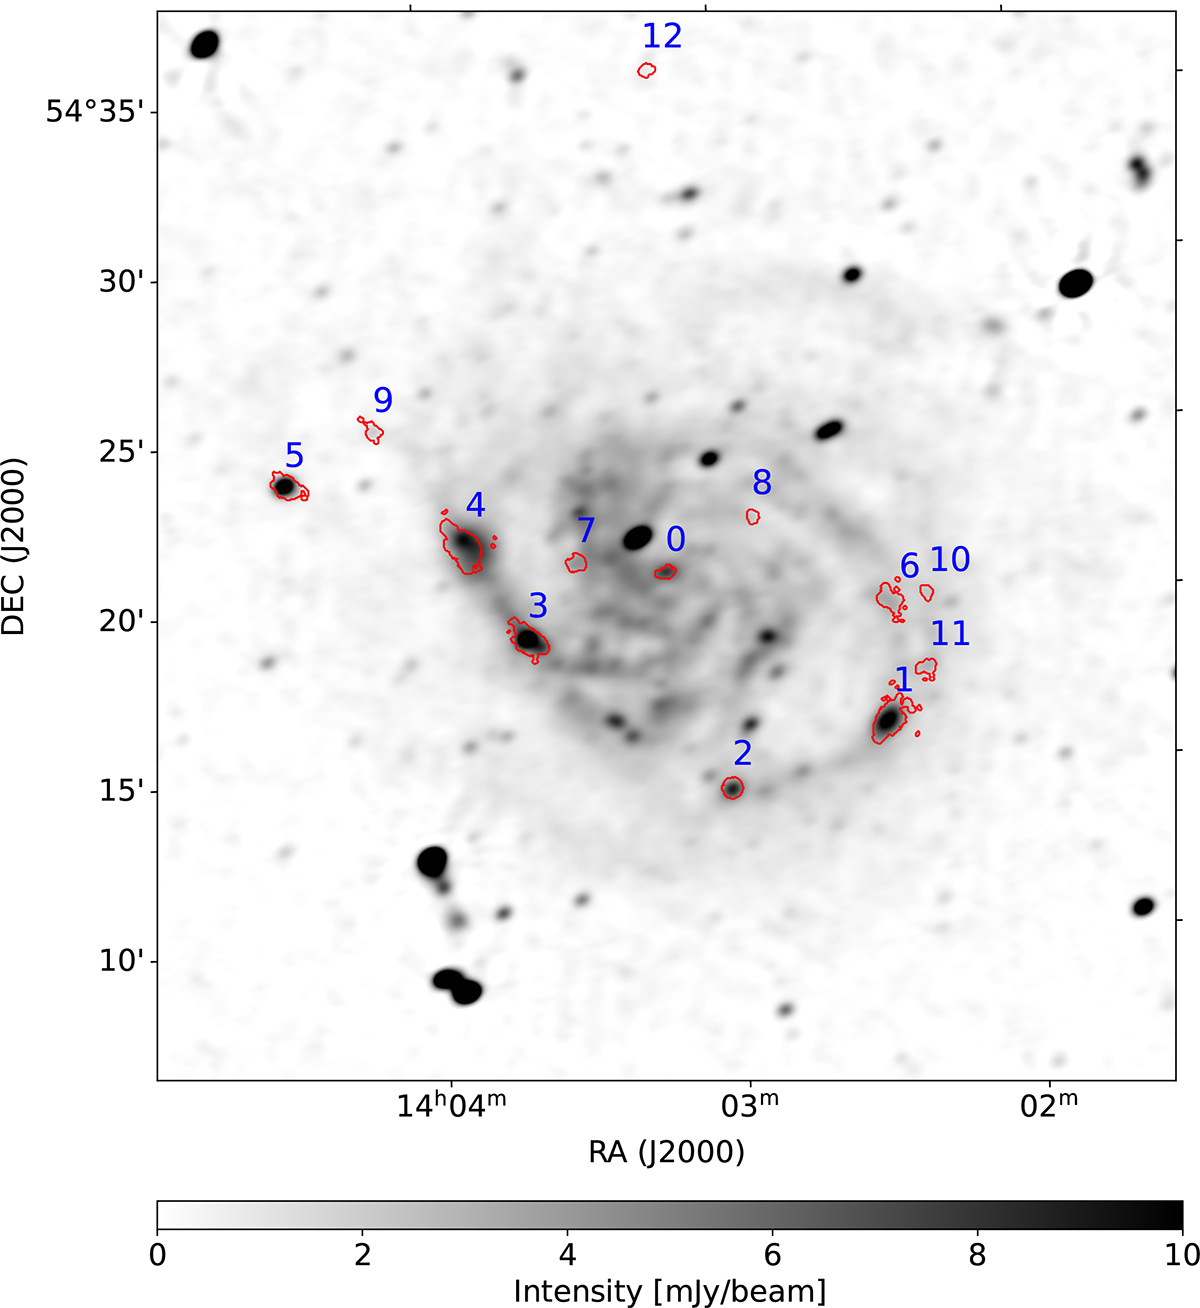
Fig. 5.
Download original image
H II region boundaries determined from Hα (Hoopes et al. 2001) plotted on top of 144 MHz radio map. The region boundaries are red and the blue numbers correspond to their identification numbers in Table 3. For the analysis we select or only regions 0–5, which are bright at 144 MHz. Note that these boundaries were only used in the H II region selection.
Current usage metrics show cumulative count of Article Views (full-text article views including HTML views, PDF and ePub downloads, according to the available data) and Abstracts Views on Vision4Press platform.
Data correspond to usage on the plateform after 2015. The current usage metrics is available 48-96 hours after online publication and is updated daily on week days.
Initial download of the metrics may take a while.