Open Access
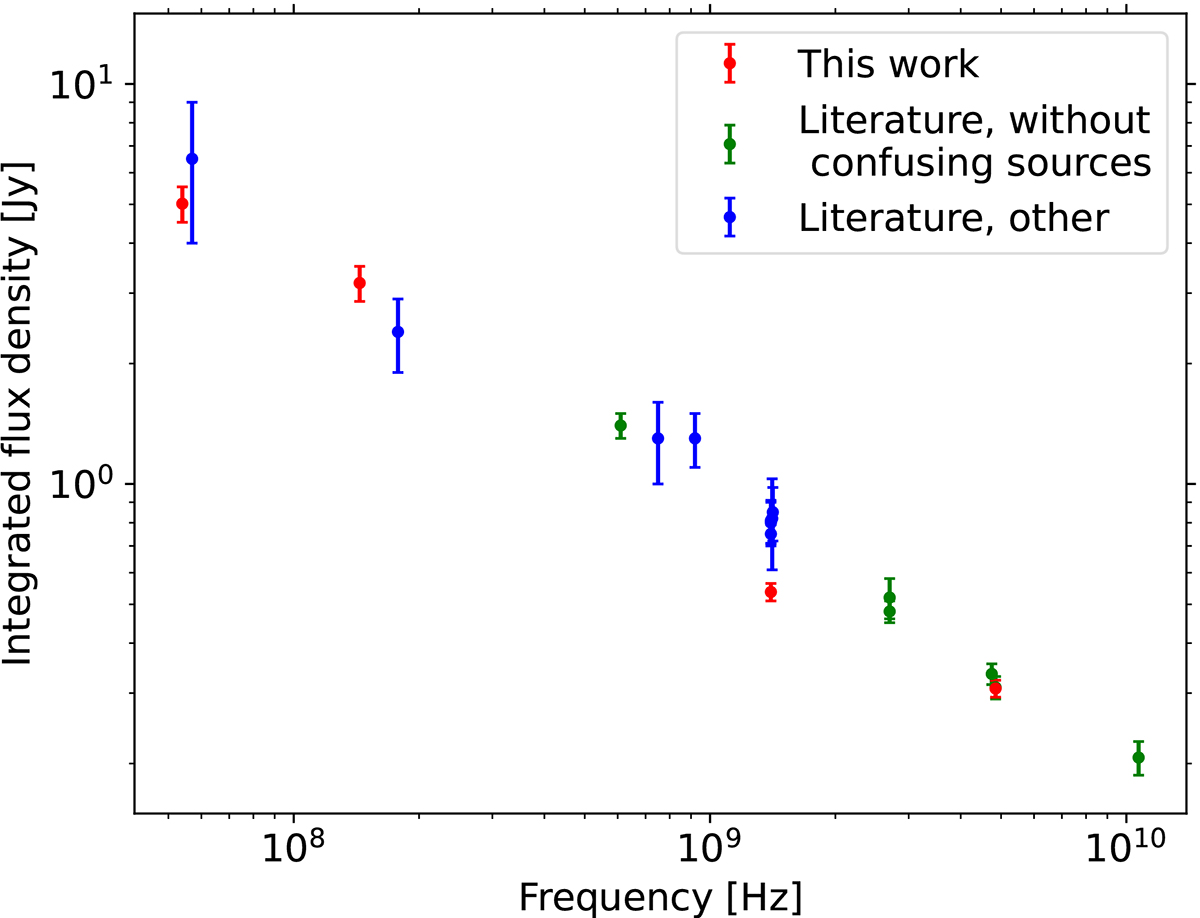
Fig. 3.
Download original image
Integrated spectrum of M 101. The flux density measurements from the maps used in this work (red) compared to literature flux density measurement, separated into those where bright background sources surrounding the galaxy are excluded (green) and are not excluded (blue).
Current usage metrics show cumulative count of Article Views (full-text article views including HTML views, PDF and ePub downloads, according to the available data) and Abstracts Views on Vision4Press platform.
Data correspond to usage on the plateform after 2015. The current usage metrics is available 48-96 hours after online publication and is updated daily on week days.
Initial download of the metrics may take a while.