Open Access
Fig. C.1.
Download original image
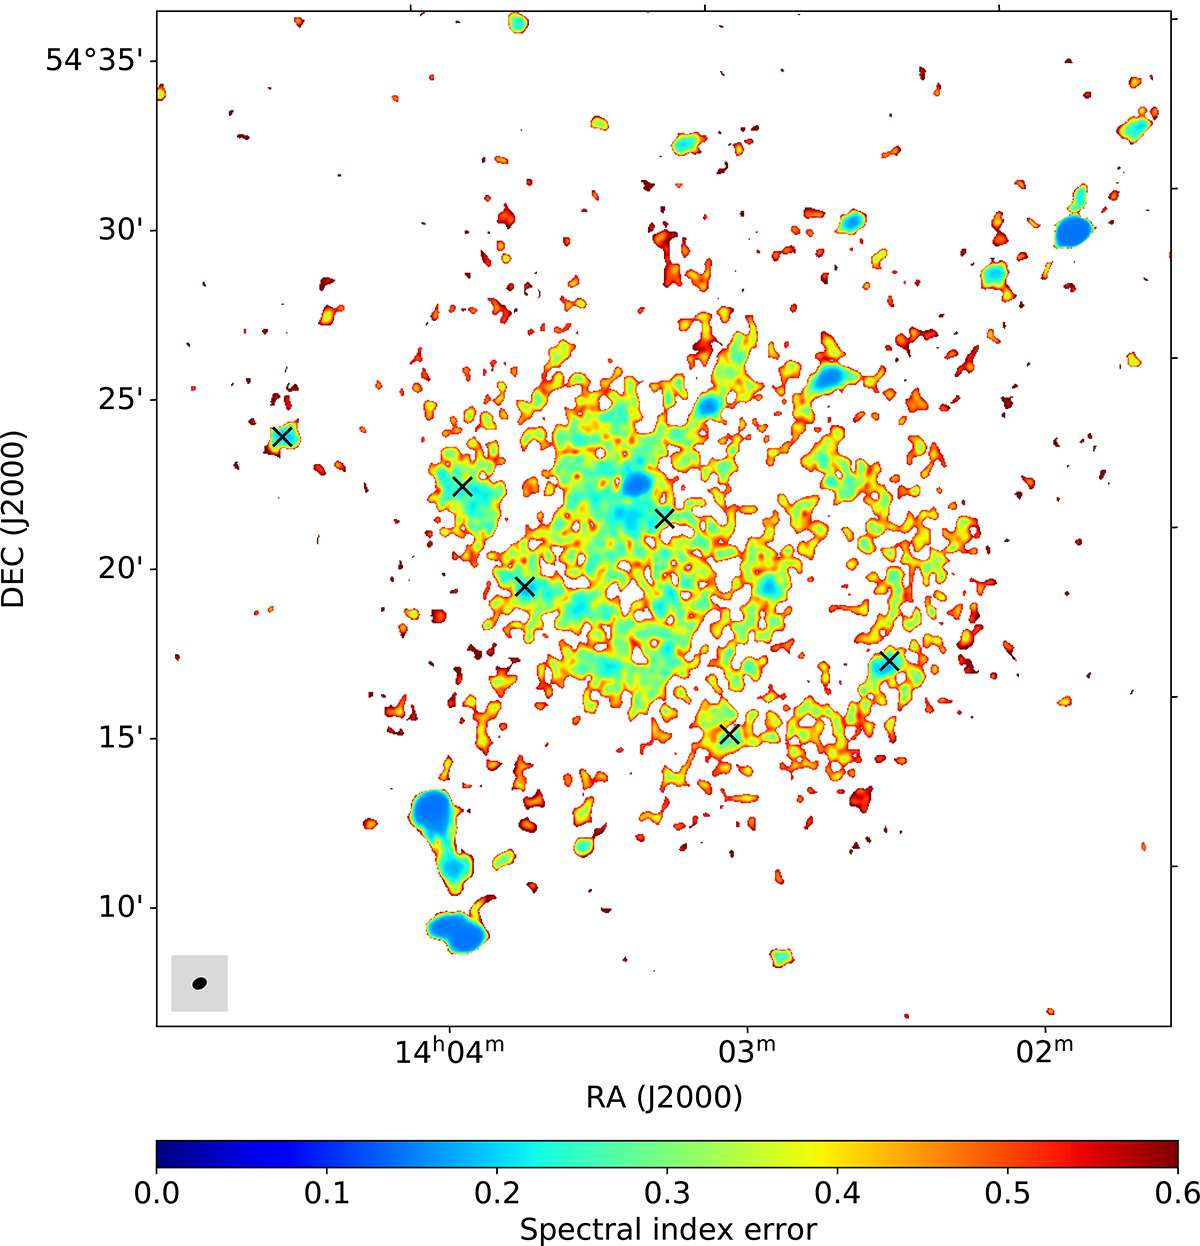
Spectral index error map between 54 MHz and 144 MHz. White areas below below 2σ are excluded. The beam size is shown with the black ellipse in the bottom left corner. The centres of the studied H II regions are marked with an x to make them easier to find.
Current usage metrics show cumulative count of Article Views (full-text article views including HTML views, PDF and ePub downloads, according to the available data) and Abstracts Views on Vision4Press platform.
Data correspond to usage on the plateform after 2015. The current usage metrics is available 48-96 hours after online publication and is updated daily on week days.
Initial download of the metrics may take a while.