Open Access
Fig. A.1.
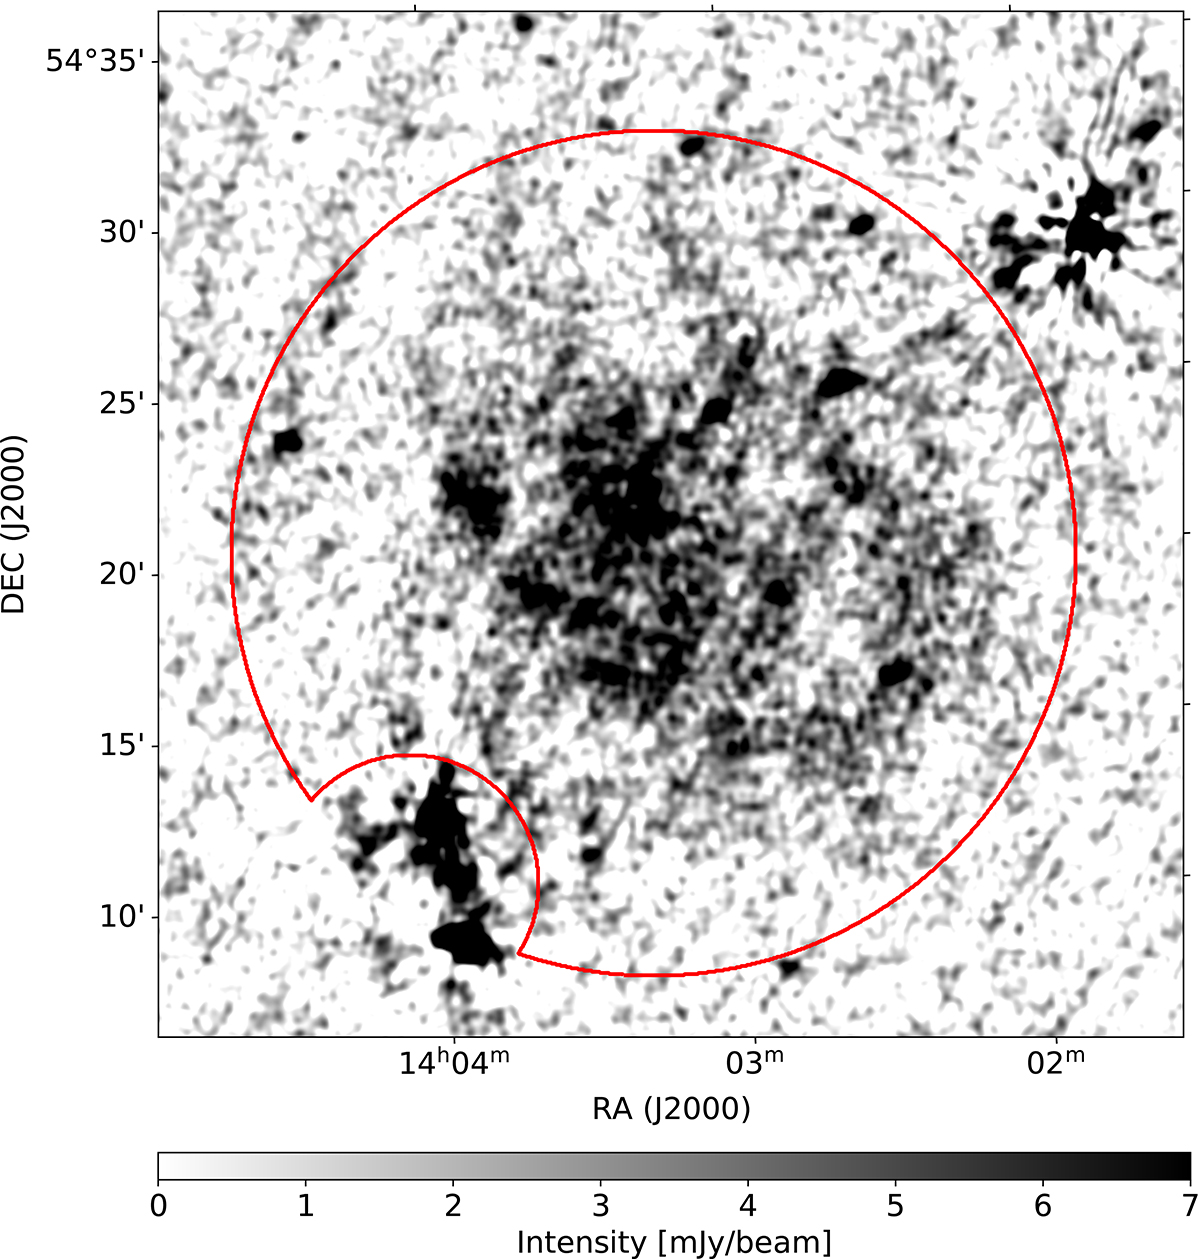
Download original image
The region in which we calculated the integrated spectrum of M101. The region is plotted in red on top of the 54 MHz LBA map. The artefacts around background sources are most prominent in the LBA map so we use that map to make sure the artefacts are excluded.
Current usage metrics show cumulative count of Article Views (full-text article views including HTML views, PDF and ePub downloads, according to the available data) and Abstracts Views on Vision4Press platform.
Data correspond to usage on the plateform after 2015. The current usage metrics is available 48-96 hours after online publication and is updated daily on week days.
Initial download of the metrics may take a while.