Open Access
Fig. 5.
Download original image
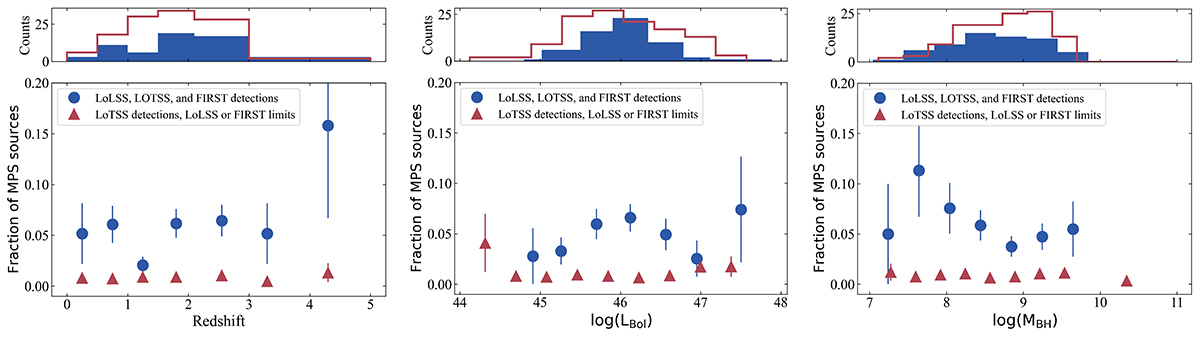
Left to right: Relationships between the fraction of MPS sources and redshift, bolometric luminosity (LBol), and black hole mass (MBH). The blue dots represent sources detected by LoTSS, LoLSS, and FIRST, while the red triangles represent sources detected by LoTSS with LoLSS/FIRST upper limits in the LoLSS DR1 sky coverage.
Current usage metrics show cumulative count of Article Views (full-text article views including HTML views, PDF and ePub downloads, according to the available data) and Abstracts Views on Vision4Press platform.
Data correspond to usage on the plateform after 2015. The current usage metrics is available 48-96 hours after online publication and is updated daily on week days.
Initial download of the metrics may take a while.