Fig. 2.
Download original image
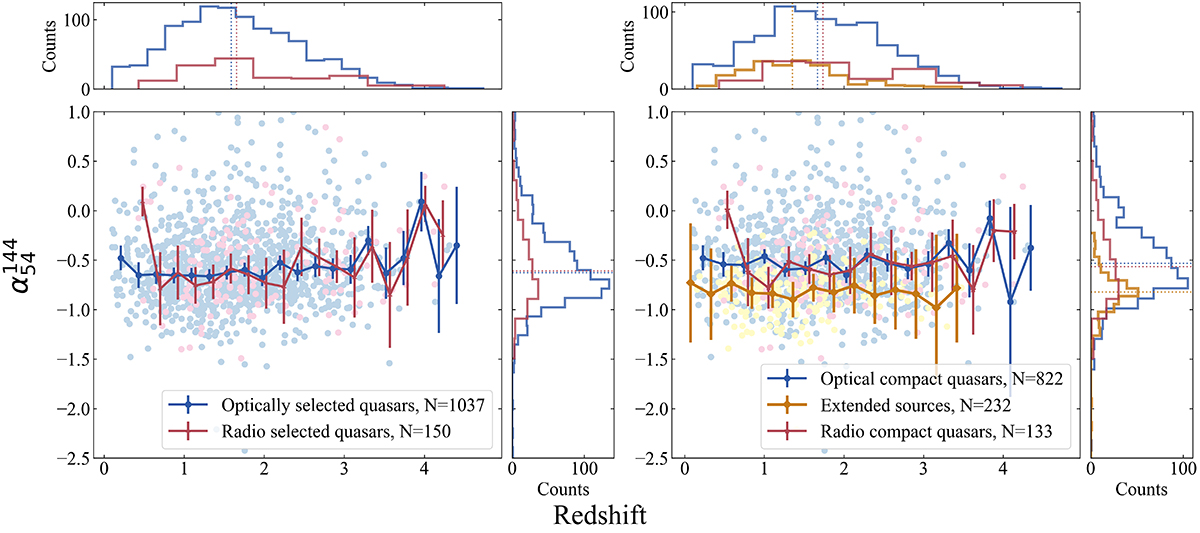
Relationship between the low-frequency spectral index (![]() ) and redshift. Left: Distributions of optical-selected (blue) and radio-selected (red) quasars. Right: Distributions for extended sources (yellow), optical compact sources (blue), and radio-compact sources (red). Error bars indicate the standard error of the mean (
) and redshift. Left: Distributions of optical-selected (blue) and radio-selected (red) quasars. Right: Distributions for extended sources (yellow), optical compact sources (blue), and radio-compact sources (red). Error bars indicate the standard error of the mean (![]() ) within each redshift bin. Blue, red, and orange lines represent optical-selected quasars, radio-selected quasars, and extended sources, respectively. Vertical lines mark the median values of each parameter in the corresponding histograms. Redshift bins were determined using Knuth’s binning method to optimize bin width (Knuth 2006). No significant trend is observed in the low-frequency spectral index (
) within each redshift bin. Blue, red, and orange lines represent optical-selected quasars, radio-selected quasars, and extended sources, respectively. Vertical lines mark the median values of each parameter in the corresponding histograms. Redshift bins were determined using Knuth’s binning method to optimize bin width (Knuth 2006). No significant trend is observed in the low-frequency spectral index (![]() ) with redshift for either sample.
) with redshift for either sample.
Current usage metrics show cumulative count of Article Views (full-text article views including HTML views, PDF and ePub downloads, according to the available data) and Abstracts Views on Vision4Press platform.
Data correspond to usage on the plateform after 2015. The current usage metrics is available 48-96 hours after online publication and is updated daily on week days.
Initial download of the metrics may take a while.