Open Access
Fig. 1.
Download original image
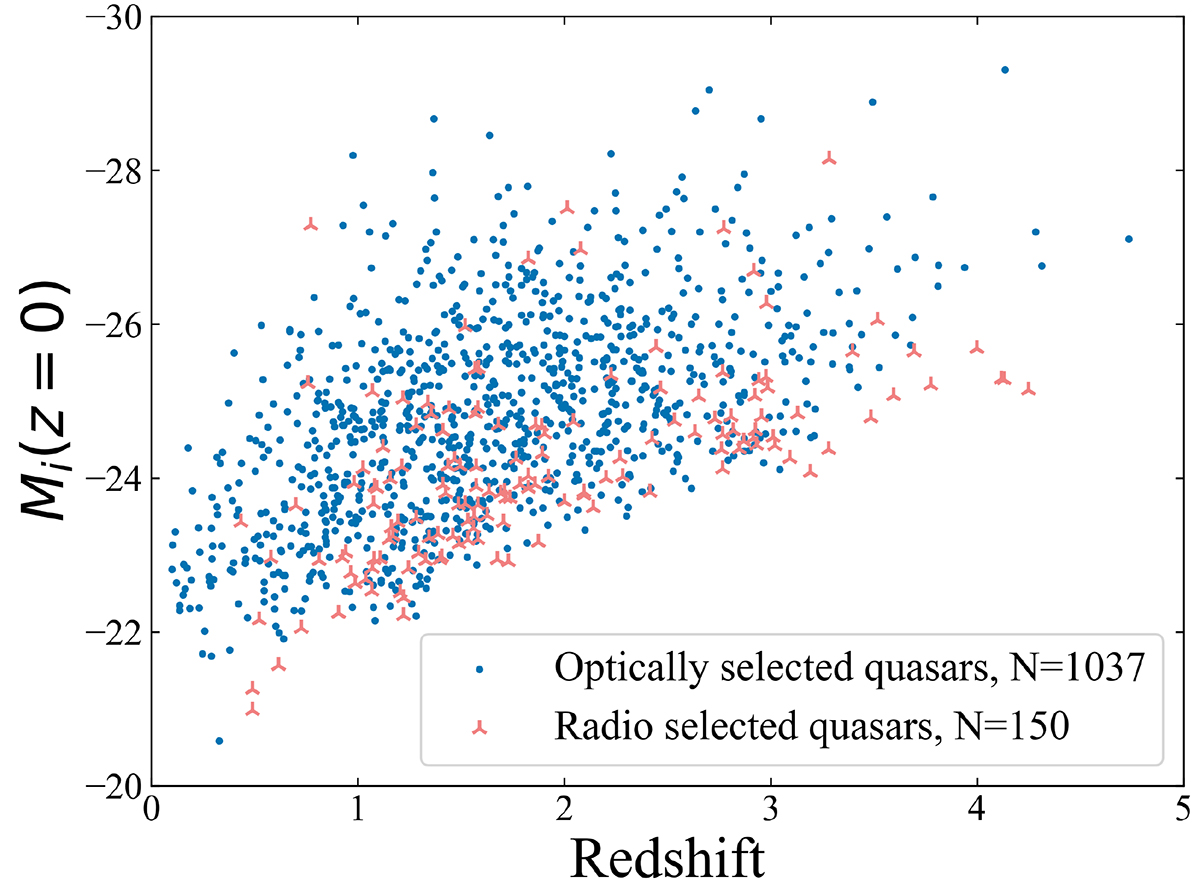
Distribution of the i-band absolute magnitude as a function of redshift. The blue dots and red triangles represent the optically selected and radio selected quasars with the LOFAR detections, respectively.
Current usage metrics show cumulative count of Article Views (full-text article views including HTML views, PDF and ePub downloads, according to the available data) and Abstracts Views on Vision4Press platform.
Data correspond to usage on the plateform after 2015. The current usage metrics is available 48-96 hours after online publication and is updated daily on week days.
Initial download of the metrics may take a while.