Fig. A.3.
Download original image
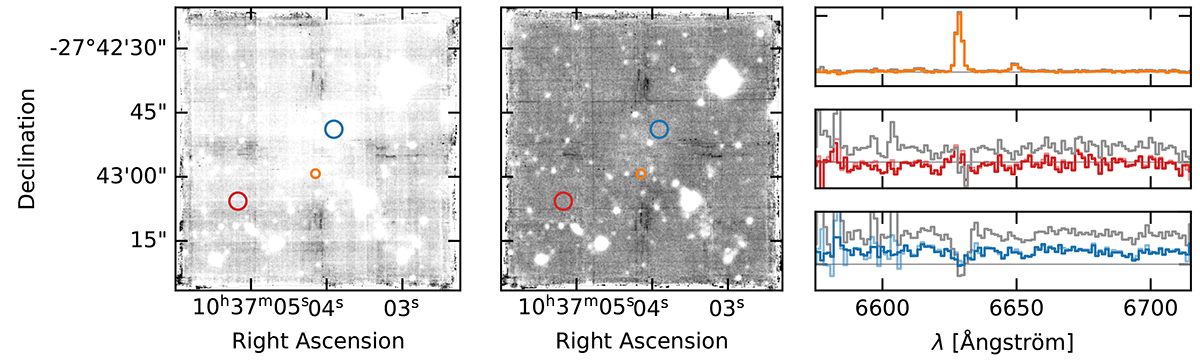
Comparison of different data reduction runs. The left panel shows the r-band image derived from the quick-reduced data and the middle one the r-band image derived from the improved reduction discussed in Appendix A. The circles denote three apertures on a patch of presumably empty sky (red), a H II knot (orange), and on the stellar body of UDG 32 away from the gaseous filament (blue). The right panels correspond to the spectra from these apertures around the Hα line with the same colour-coding. In each panel, the grey lines correspond to the spectra extracted from the quick-reduced data, the lightly coloured lines to the improved reduction before running ZAP and the opaque coloured lines to the ZAPped spectra.
Current usage metrics show cumulative count of Article Views (full-text article views including HTML views, PDF and ePub downloads, according to the available data) and Abstracts Views on Vision4Press platform.
Data correspond to usage on the plateform after 2015. The current usage metrics is available 48-96 hours after online publication and is updated daily on week days.
Initial download of the metrics may take a while.