Open Access
Fig. A.1.
Download original image
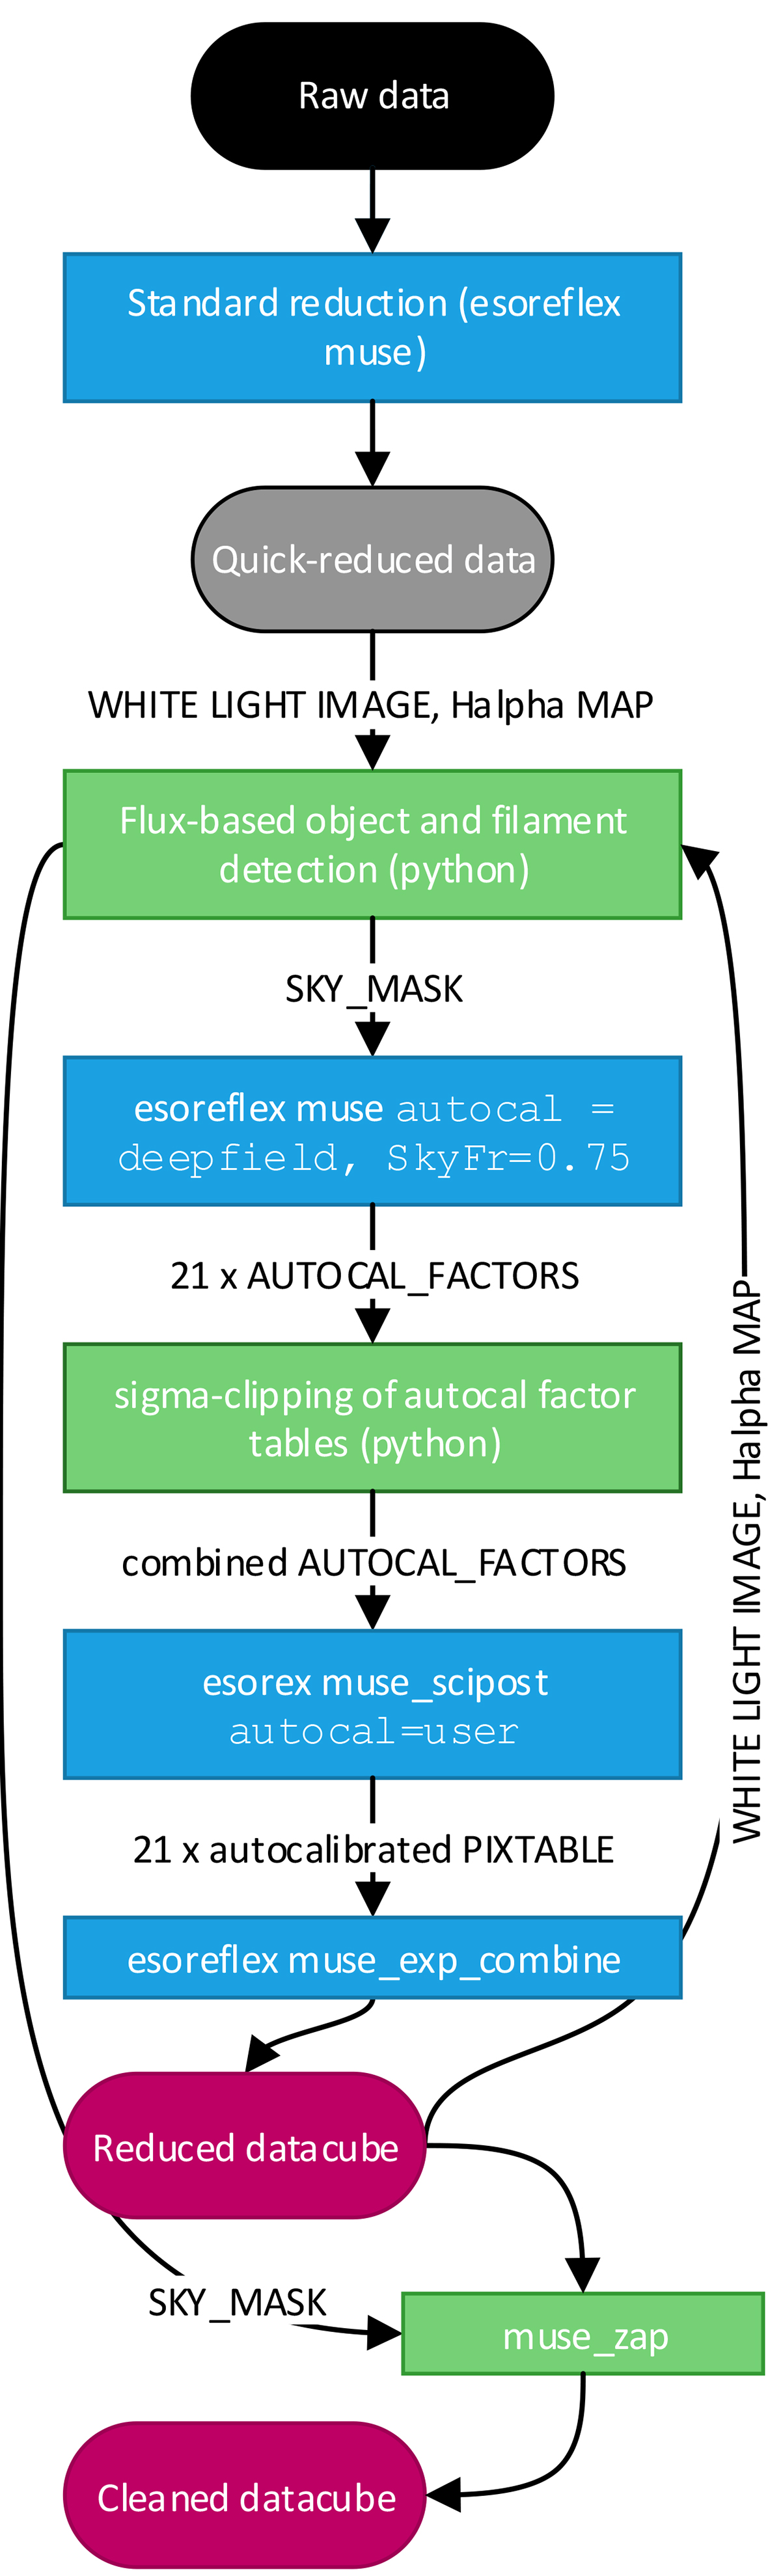
Data reduction flowchart sketching the process of obtaining the cleaned datacube from raw data. ESO reflex and esorex pipeline processes are shown in blue and auxiliary python routines in green boxes.
Current usage metrics show cumulative count of Article Views (full-text article views including HTML views, PDF and ePub downloads, according to the available data) and Abstracts Views on Vision4Press platform.
Data correspond to usage on the plateform after 2015. The current usage metrics is available 48-96 hours after online publication and is updated daily on week days.
Initial download of the metrics may take a while.