Fig. 3.
Download original image
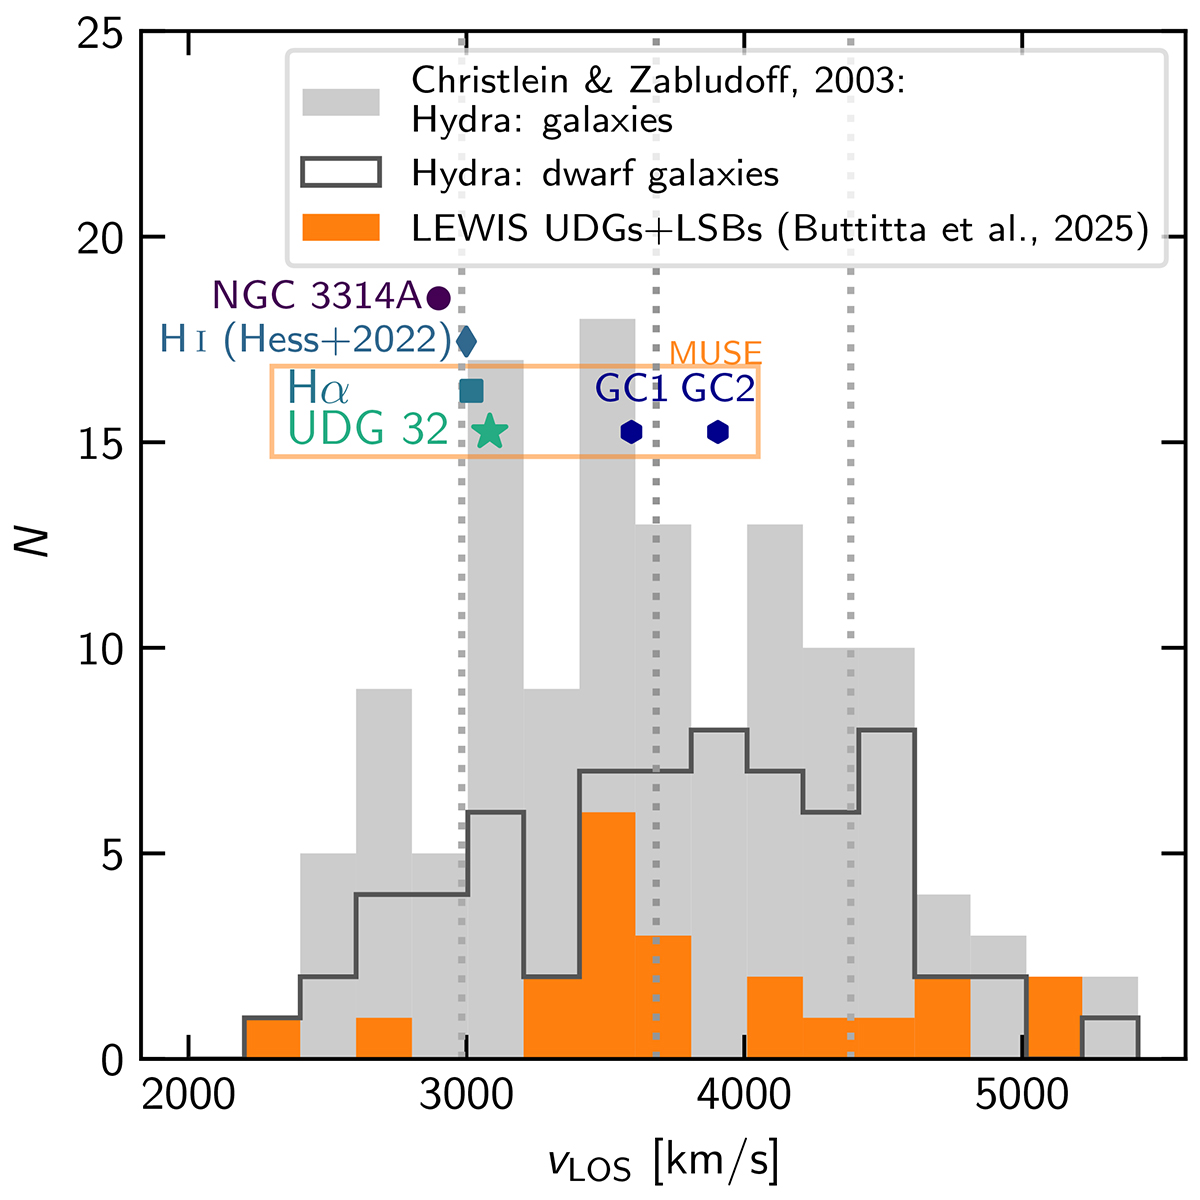
Velocity distribution of galaxies in the Hydra I cluster (grey histogram, Christlein & Zabludoff 2003), the LEWIS UDGs and LSBs (Buttitta et al. 2025, orange histogram), NGC 3314A (purple circle, Kaldare et al. 2003), and the ram-pressure stripped H I gas (teal diamond, Hess et al. 2022). Velocities derived from the LEWIS observations of UDG 32 are in the orange box: the Hα arm velocity (square), the velocity of UDG 32 based on the short spectrum around Hα (star), and the velocities of the two GCs (hexagons). The mean velocity of the Hydra I cluster and its 1σ-limits (Lima-Dias et al. 2021) are denoted with vertical dotted lines.
Current usage metrics show cumulative count of Article Views (full-text article views including HTML views, PDF and ePub downloads, according to the available data) and Abstracts Views on Vision4Press platform.
Data correspond to usage on the plateform after 2015. The current usage metrics is available 48-96 hours after online publication and is updated daily on week days.
Initial download of the metrics may take a while.