Open Access
Fig. G.1.
Download original image
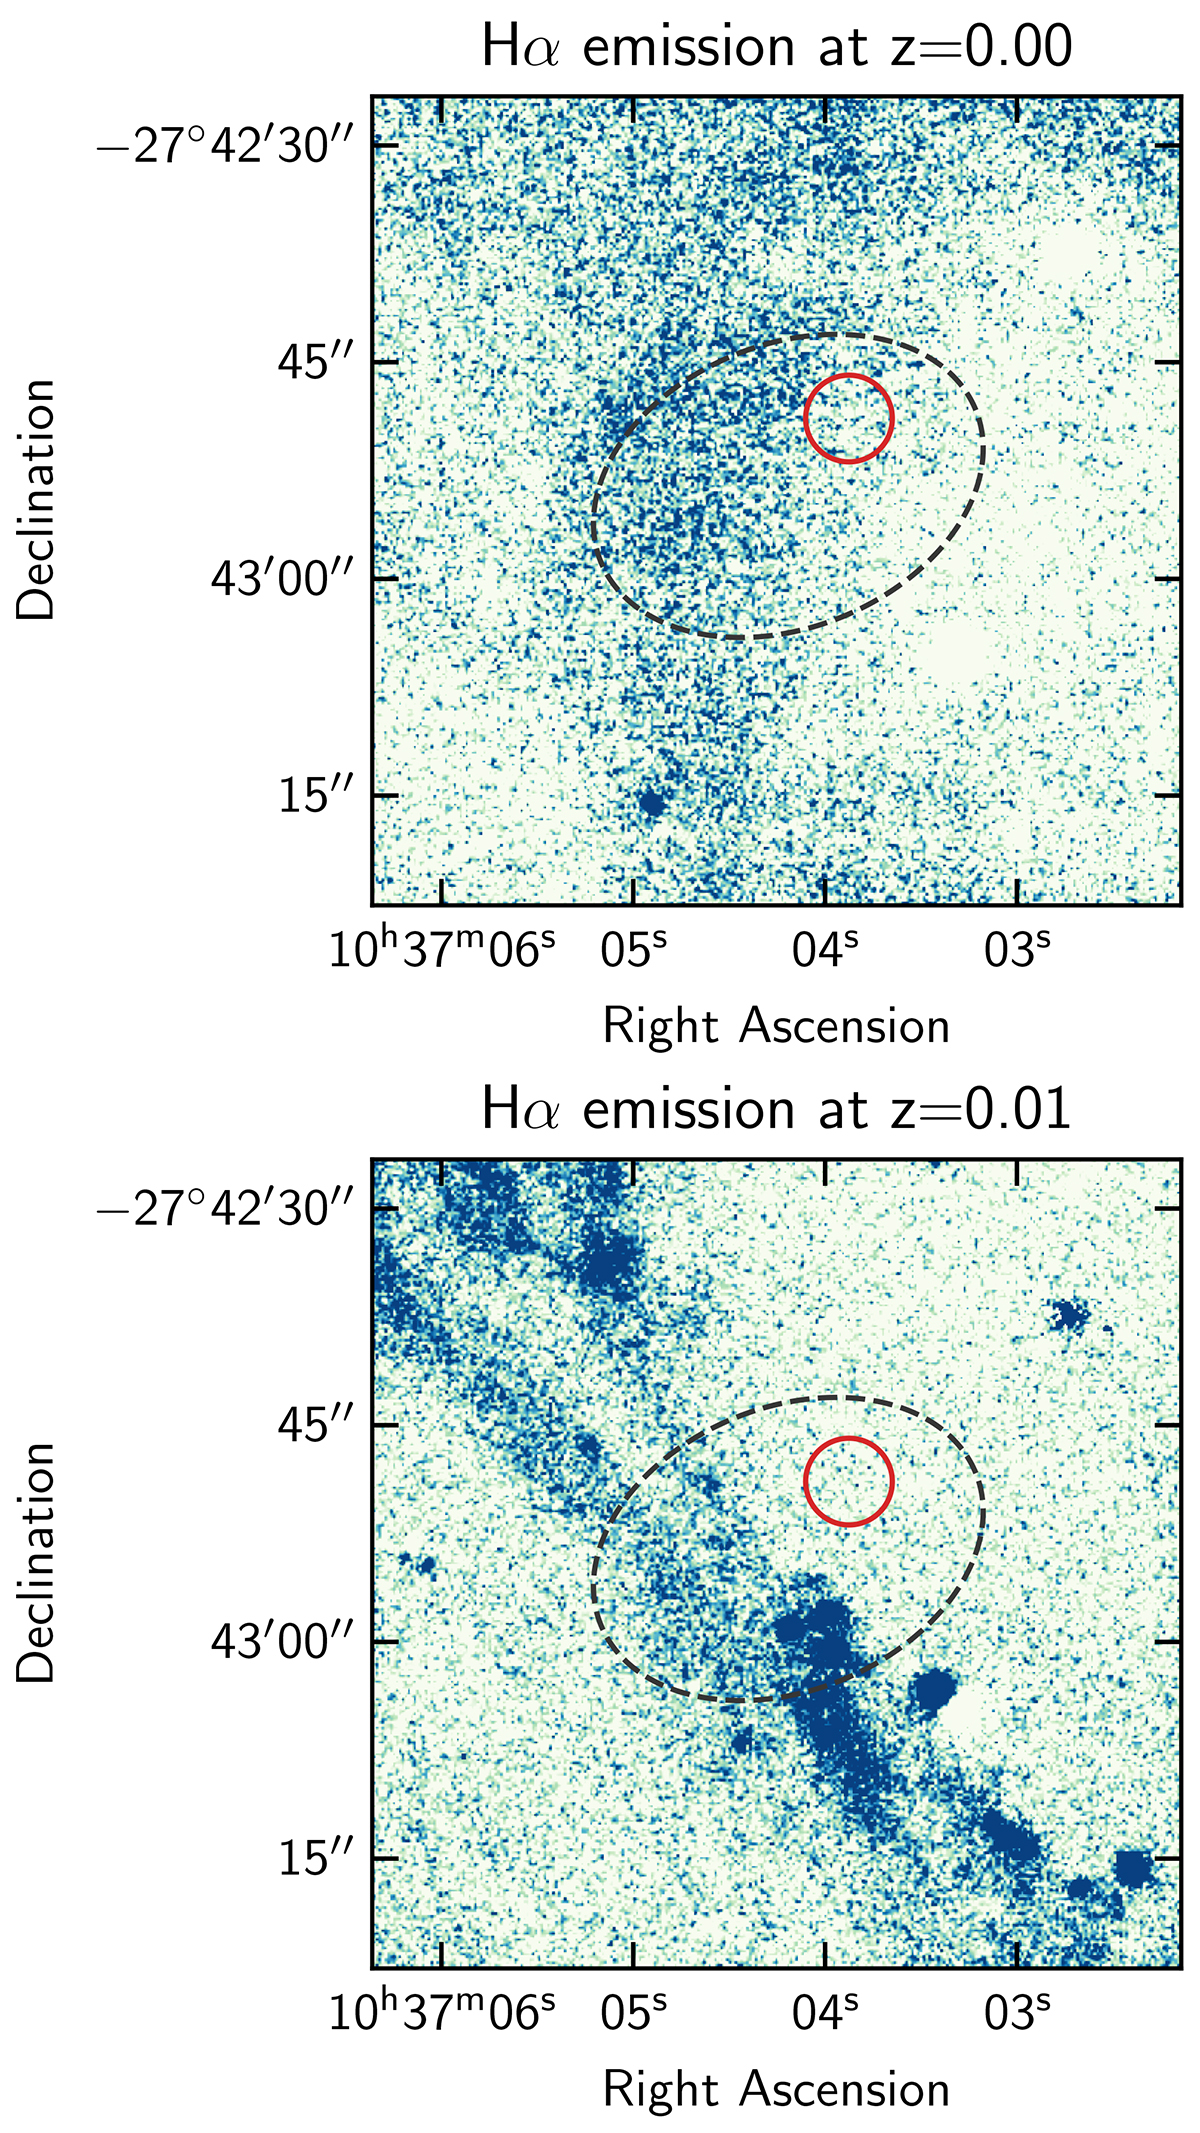
Maps centred on the Hα emission at redshifts z = 0.00 (top panel) and z = 0.01 (bottom panel) with the same intensity cuts. For reference, we again show the aperture in which we extract the spectrum of UDG 32 in red and the footprint of the UDG from photometry (Iodice et al. 2021) with the dashed ellipse.
Current usage metrics show cumulative count of Article Views (full-text article views including HTML views, PDF and ePub downloads, according to the available data) and Abstracts Views on Vision4Press platform.
Data correspond to usage on the plateform after 2015. The current usage metrics is available 48-96 hours after online publication and is updated daily on week days.
Initial download of the metrics may take a while.