Fig. F.1.
Download original image
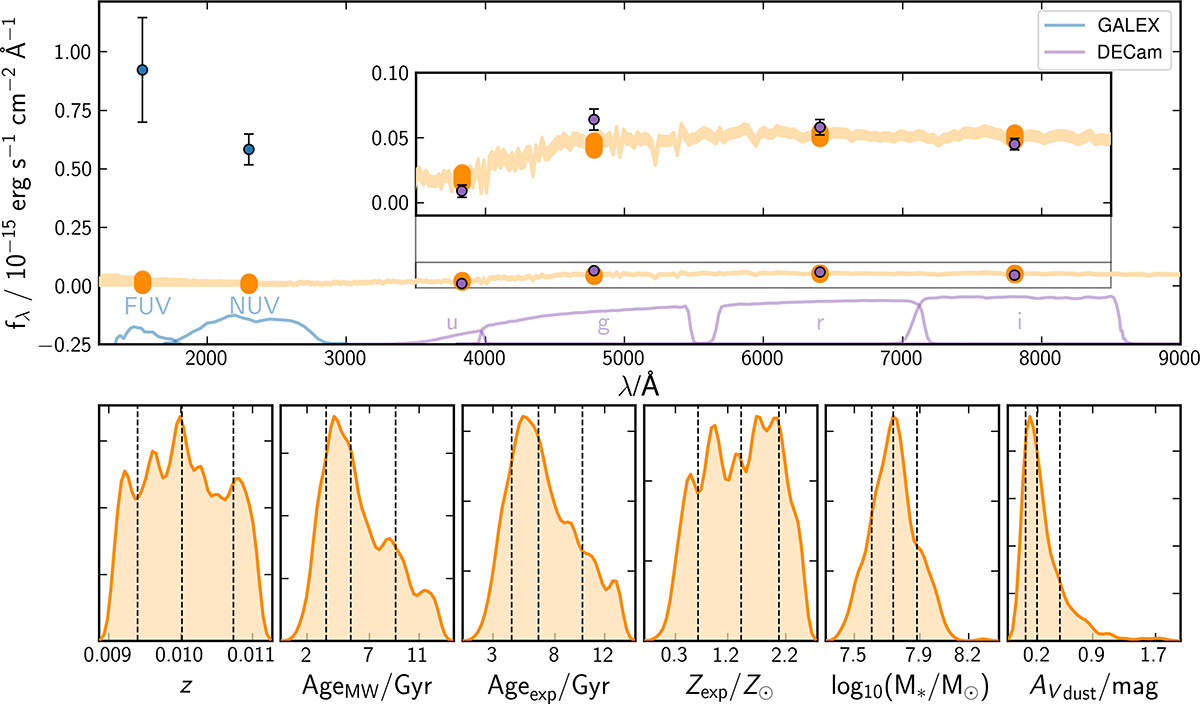
BAGPIPES fitting of the UV and optical SED. Top: Observed SED (coloured points) and best-fit model spectrum (orange). The lines at the bottom of the panel show the filter bandpasses of the imaging data used in the fit. The inset shows a zoom into the optical part of the SED. Bottom: Posterior probability distribution of the fitted and derived model parameters redshift z, mass-weighted age AgeMW, the time since the SFH began Ageexp, metallicity Zexp, stellar mass M*, and dust extinction AV. The 16, 50, and 84 percentiles are shown with vertical dashed lines.
Current usage metrics show cumulative count of Article Views (full-text article views including HTML views, PDF and ePub downloads, according to the available data) and Abstracts Views on Vision4Press platform.
Data correspond to usage on the plateform after 2015. The current usage metrics is available 48-96 hours after online publication and is updated daily on week days.
Initial download of the metrics may take a while.