Fig. D.1.
Download original image
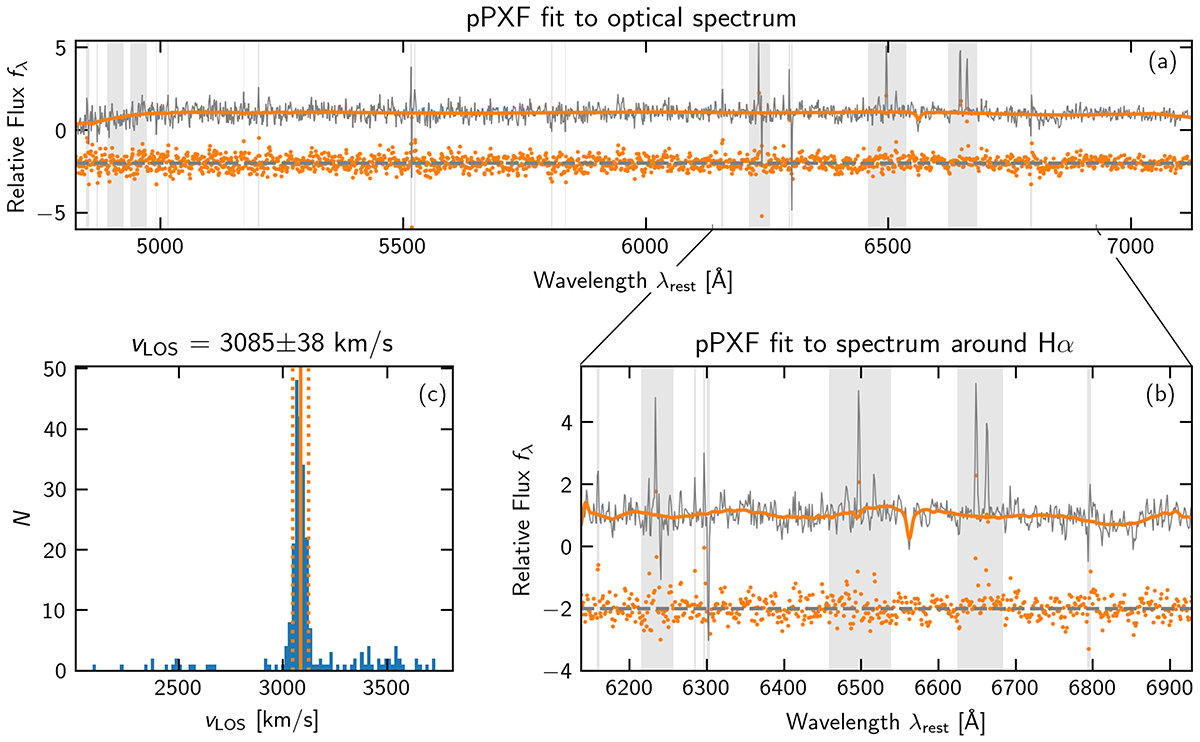
Results of the spectral fitting with PPXF. a: Optical spectrum of UDG 32 extracted from the 3″-radius aperture in Fig. 1 (grey) with the best fit from PPXF overplotted in orange. Light grey vertical bands denote masked regions. b: Same as panel a, but restricted to the region around the Hα line with a separate PPXF fit. c: Posterior probability distribution of vLOS corresponding to the wild bootstrapping of the PPXF fit shown in panel b. The orange vertical lines show the median velocity (solid) and its uncertainties (dotted).
Current usage metrics show cumulative count of Article Views (full-text article views including HTML views, PDF and ePub downloads, according to the available data) and Abstracts Views on Vision4Press platform.
Data correspond to usage on the plateform after 2015. The current usage metrics is available 48-96 hours after online publication and is updated daily on week days.
Initial download of the metrics may take a while.