Fig. 7
Download original image
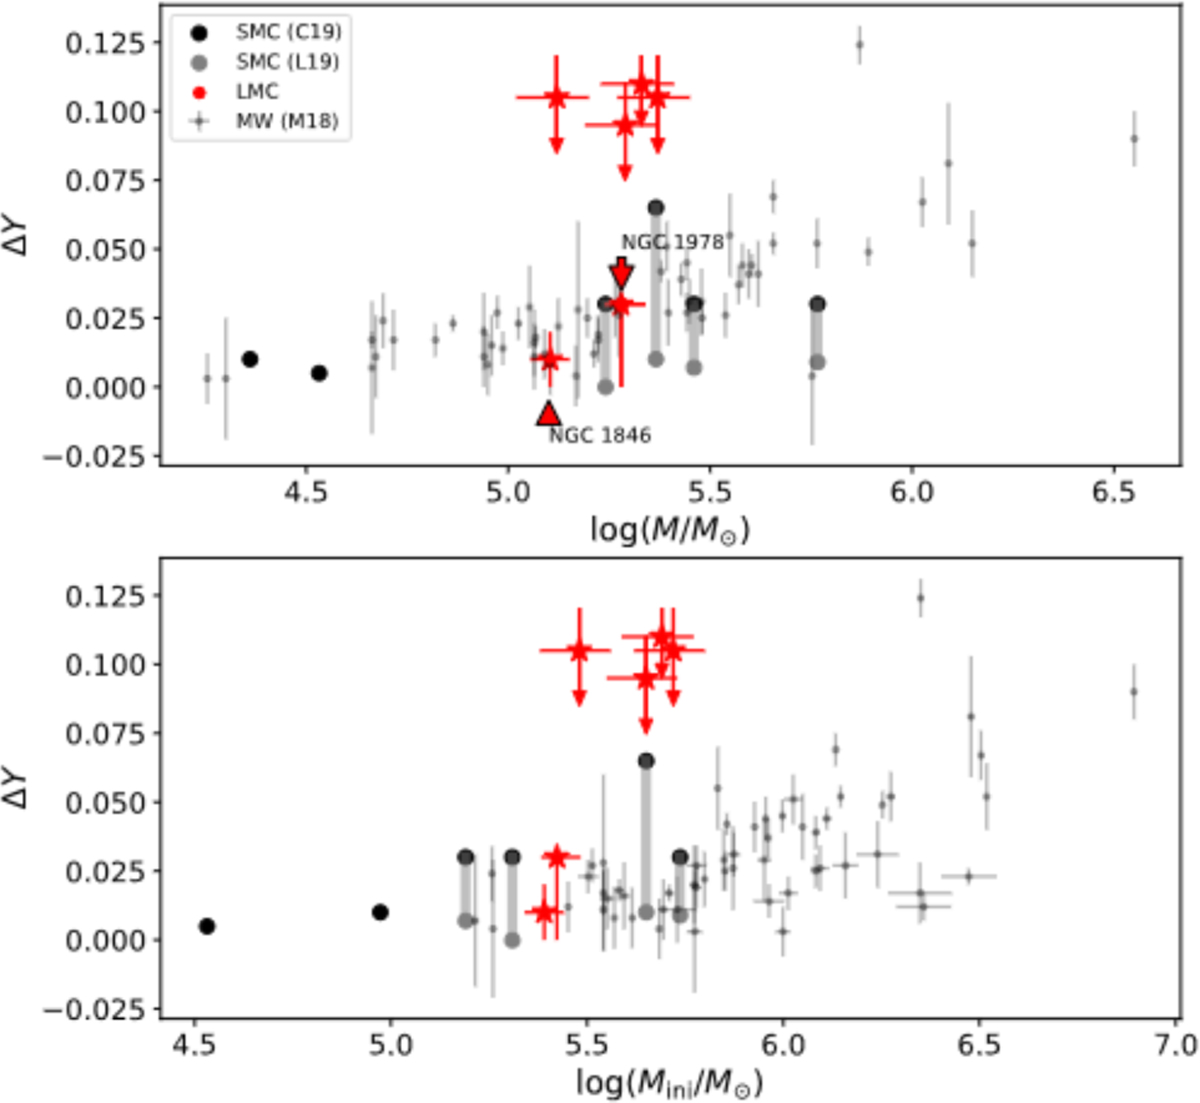
Internal helium spread and cluster mass relationships. Top: the internal helium spreads and the clusters present-day masses diagram, δY − log( M/M⊙). Red pentagrams are LMC clusters. Small grey dots are Milky Way GCs. Dark/light grey circles are SMC clusters. Bottom: the correlation between the internal helium spreads and the clusters initial masses, for Milky Way GCs, LMC and SMC clusters. The arrow indicates that we consider this value to represent only an upper limit. The arrow indicates that we consider this value to represent only an upper limit.
Current usage metrics show cumulative count of Article Views (full-text article views including HTML views, PDF and ePub downloads, according to the available data) and Abstracts Views on Vision4Press platform.
Data correspond to usage on the plateform after 2015. The current usage metrics is available 48-96 hours after online publication and is updated daily on week days.
Initial download of the metrics may take a while.