Fig. 3
Download original image
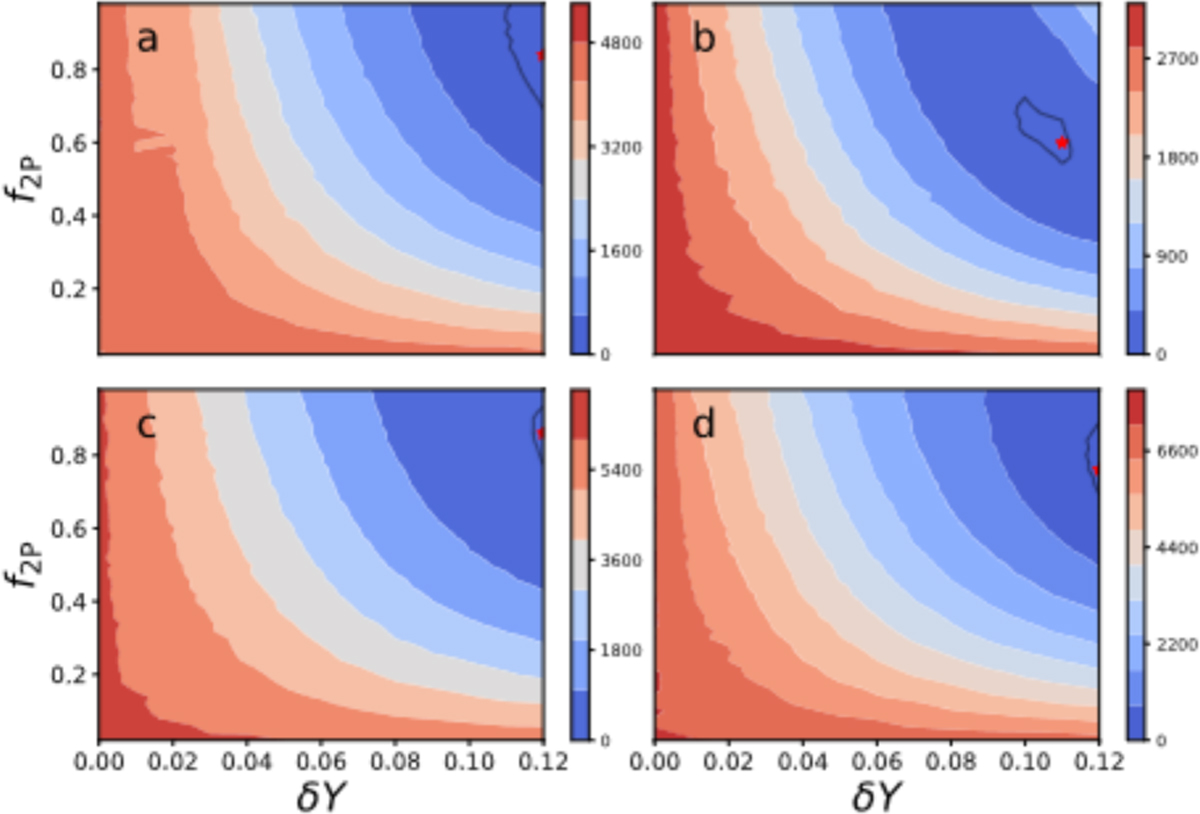
χ2 contour maps as a function of internal He spread, δY, and fraction of He-enriched stars, f2P . χ2 values are coded by colors. Best-fitting points (minimum χ2) are represented by red stars. Black solid lines indicate 1σ uncertainties, calculated from χ2 variations. The adopted model assumes a uniform He distribution. Panels a, b, c, and d correspond to clusters Hodge 11, NGC 1841, NGC 2210, and NGC 2257, respectively.
Current usage metrics show cumulative count of Article Views (full-text article views including HTML views, PDF and ePub downloads, according to the available data) and Abstracts Views on Vision4Press platform.
Data correspond to usage on the plateform after 2015. The current usage metrics is available 48-96 hours after online publication and is updated daily on week days.
Initial download of the metrics may take a while.