Fig. D.1
Download original image
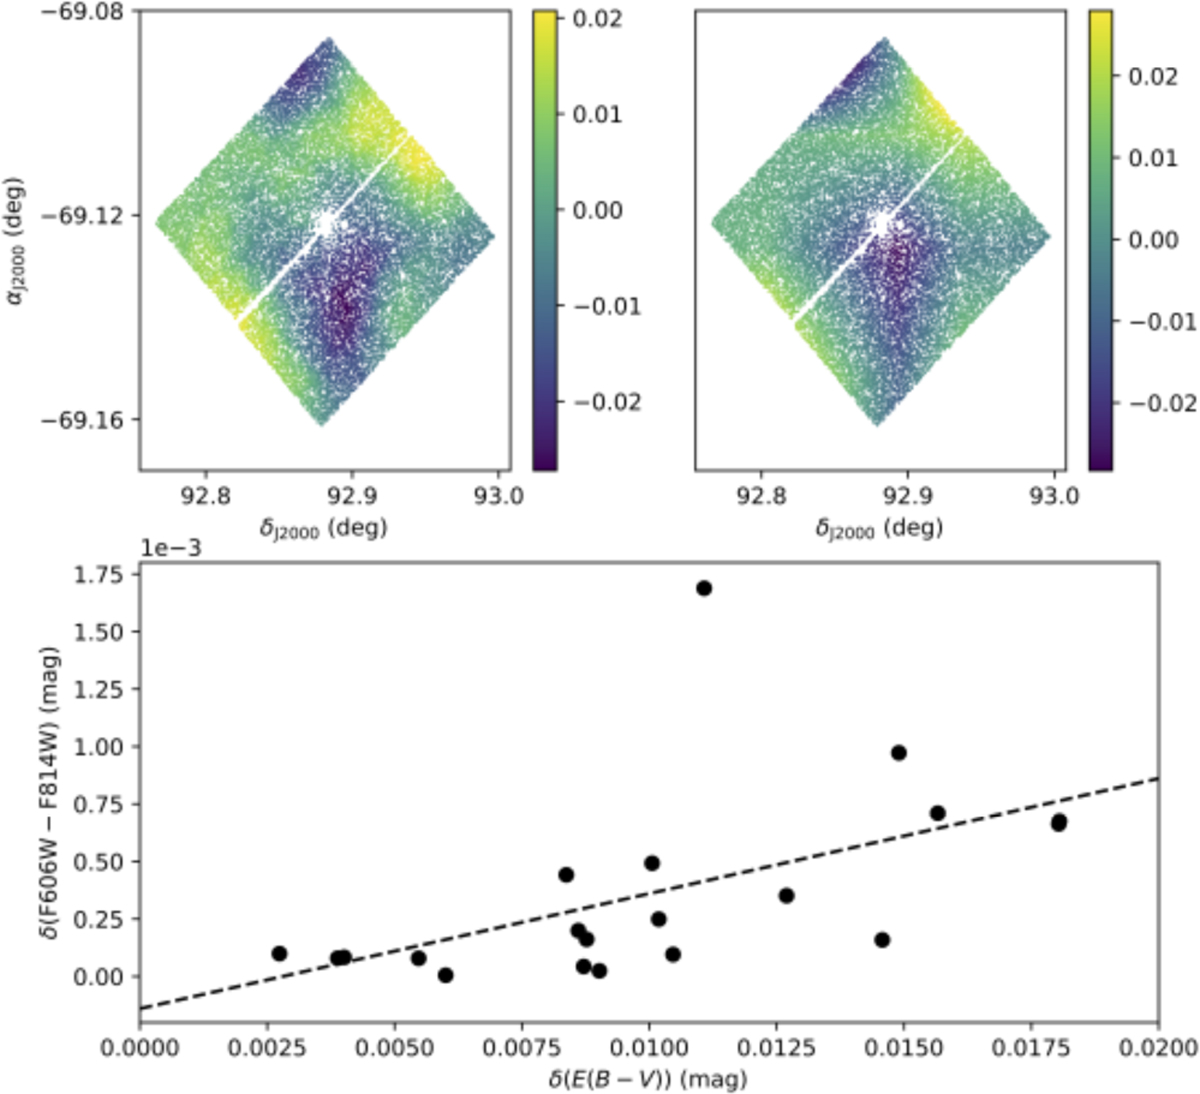
Deriving differential reddening residuals. The upper panels show the distribution of simulated stars with differential extinctions (upper-left), and with their differential extinction distribution derived from statistical methods (upper-right, see Section 2.5). The lower panel displays the correlation between the color residuals (after we corrected the differential extinction) and the values of differential extinctions.
Current usage metrics show cumulative count of Article Views (full-text article views including HTML views, PDF and ePub downloads, according to the available data) and Abstracts Views on Vision4Press platform.
Data correspond to usage on the plateform after 2015. The current usage metrics is available 48-96 hours after online publication and is updated daily on week days.
Initial download of the metrics may take a while.