Fig. 9
Download original image
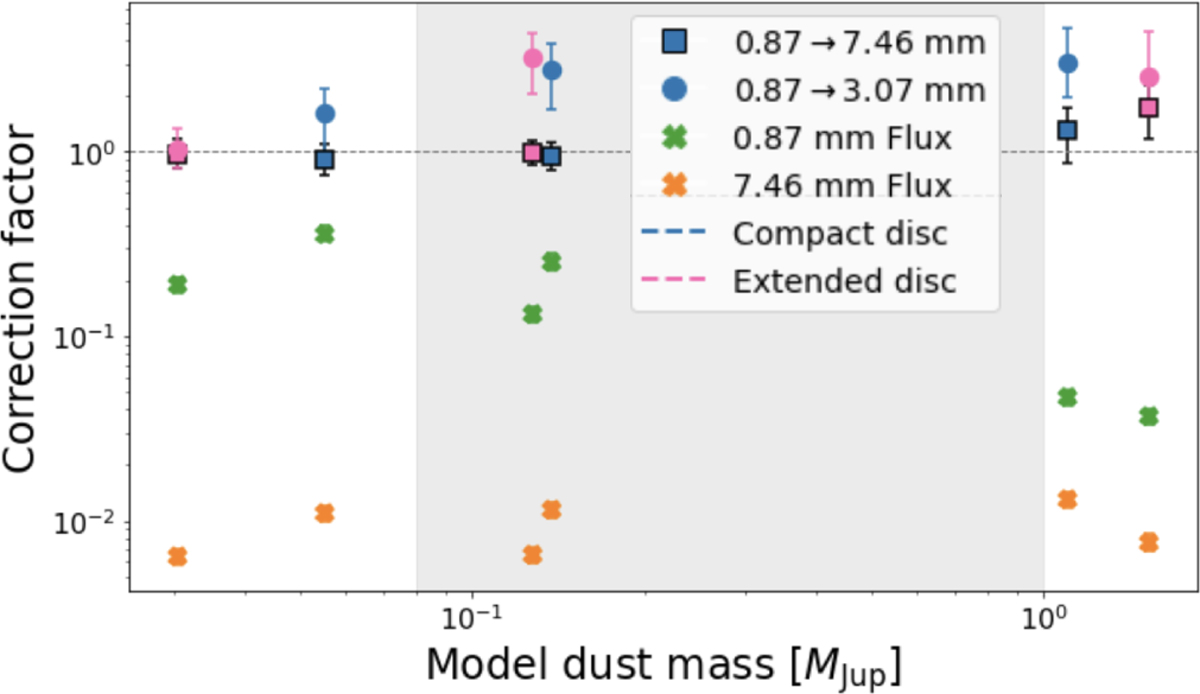
Correction factor, i.e., the ratio of the measured to the model dust mass, for various measurement techniques. The circles refer to the masses measured from SED analyses including the emission from 0.87 mm to 3.07 mm, in blue for the compact disk model and in pink for the extended disk morphology (see Sect. 2). With a black-bordered square we show the masses measured from SED analyses that also include the 7.46 mm emission. The correction factors that we obtain by measuring the dust mass from the 0.87 mm (green cross) and 7.46 mm (orange cross) fluxes through Equation (12) are also displayed. The gray shadow highlights the range of dust masses that we can typically expect from ALMA detections of T Tauri disks (scenario ii; see Sect. 4.1). The horizontal dashed line marks a accurately estimated dust mass.
Current usage metrics show cumulative count of Article Views (full-text article views including HTML views, PDF and ePub downloads, according to the available data) and Abstracts Views on Vision4Press platform.
Data correspond to usage on the plateform after 2015. The current usage metrics is available 48-96 hours after online publication and is updated daily on week days.
Initial download of the metrics may take a while.