Fig. 7
Download original image
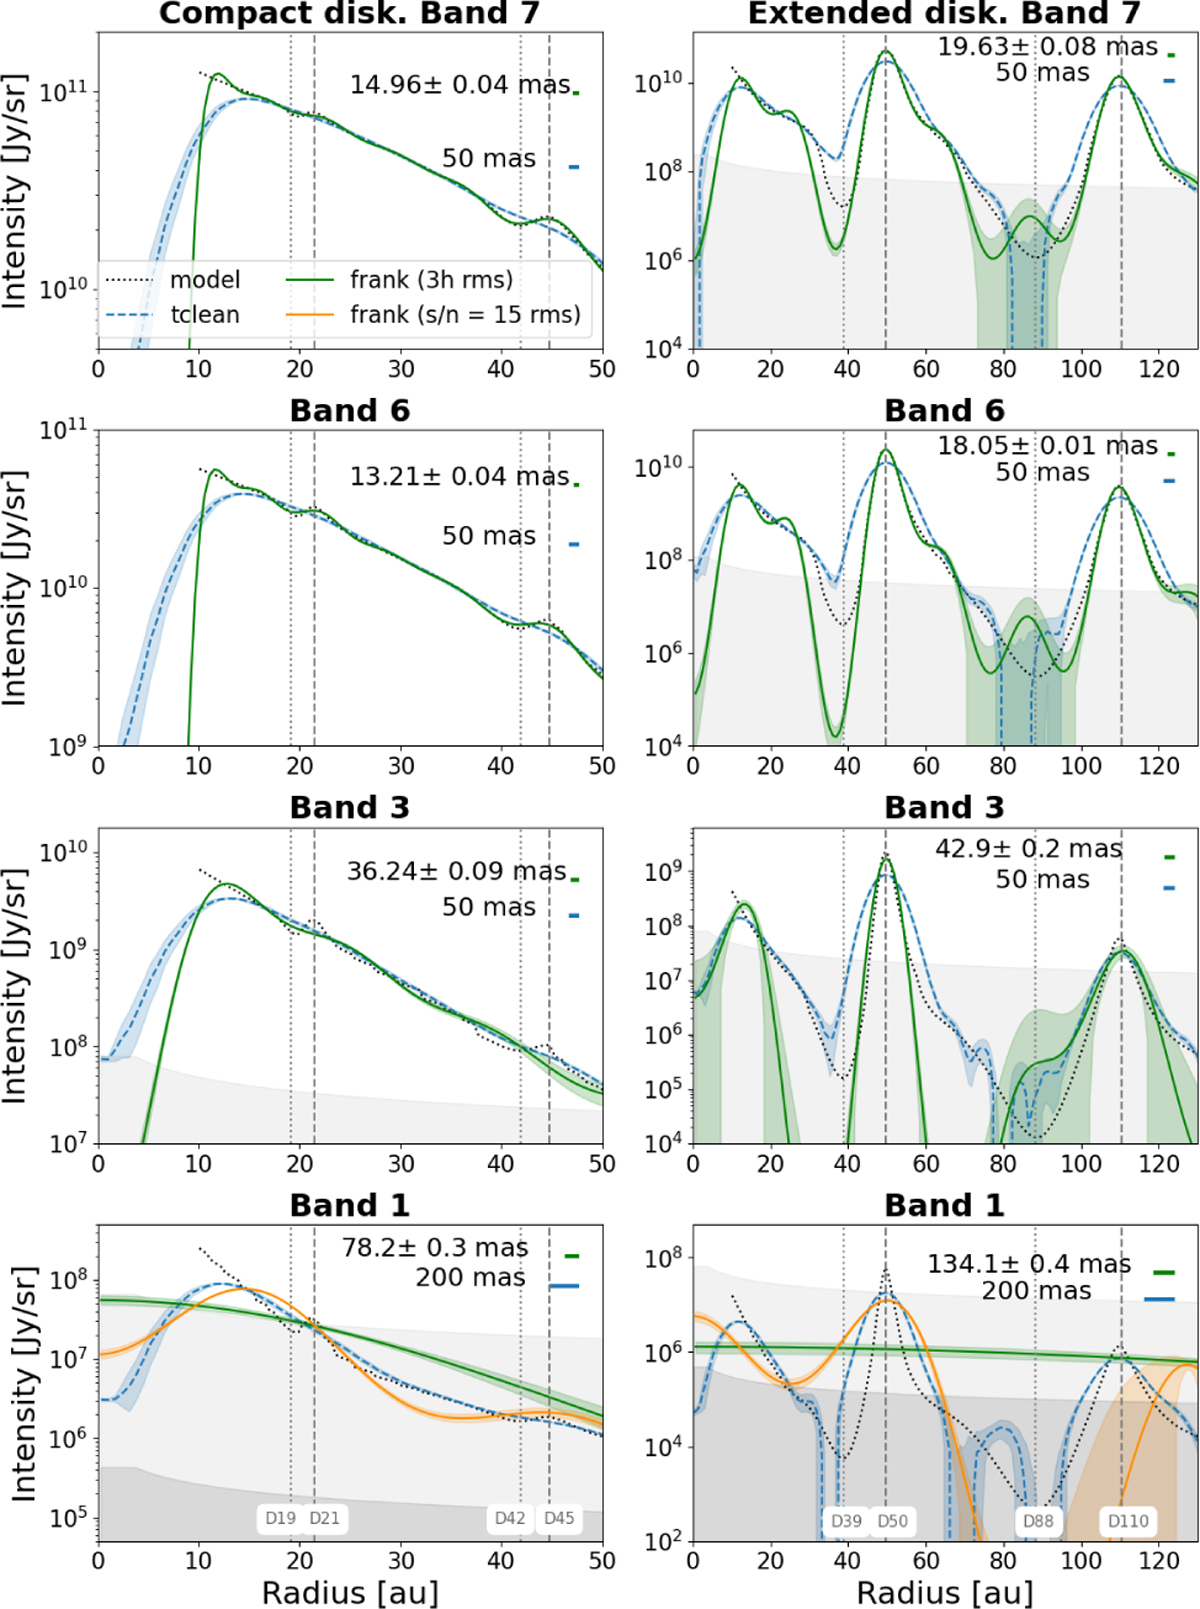
Frank fits of the multi-band observations of the compact (left) and extended (right) disk models. The fits to the visibilities with the expected noise level after 3 hours of observing time are shown in green. The light gray shadow in each panel is the corresponding radially averaged noise level. The model intensity profiles are plotted in black and the tclean profiles in blue. For Band 1 (bottom panel), the fits to the visibilities with an azimuthally averaged signal-to-noise ratio of 15 in the outer ring are also shown in orange and the corresponding noise level is represented as a dark gray shadow. The vertical gray lines in each panel represent the positions of the bright (B) and dark (D) gaps in the dust surface density profile. In each panel the intrinsic resolution of the Frank fits are reported.
Current usage metrics show cumulative count of Article Views (full-text article views including HTML views, PDF and ePub downloads, according to the available data) and Abstracts Views on Vision4Press platform.
Data correspond to usage on the plateform after 2015. The current usage metrics is available 48-96 hours after online publication and is updated daily on week days.
Initial download of the metrics may take a while.