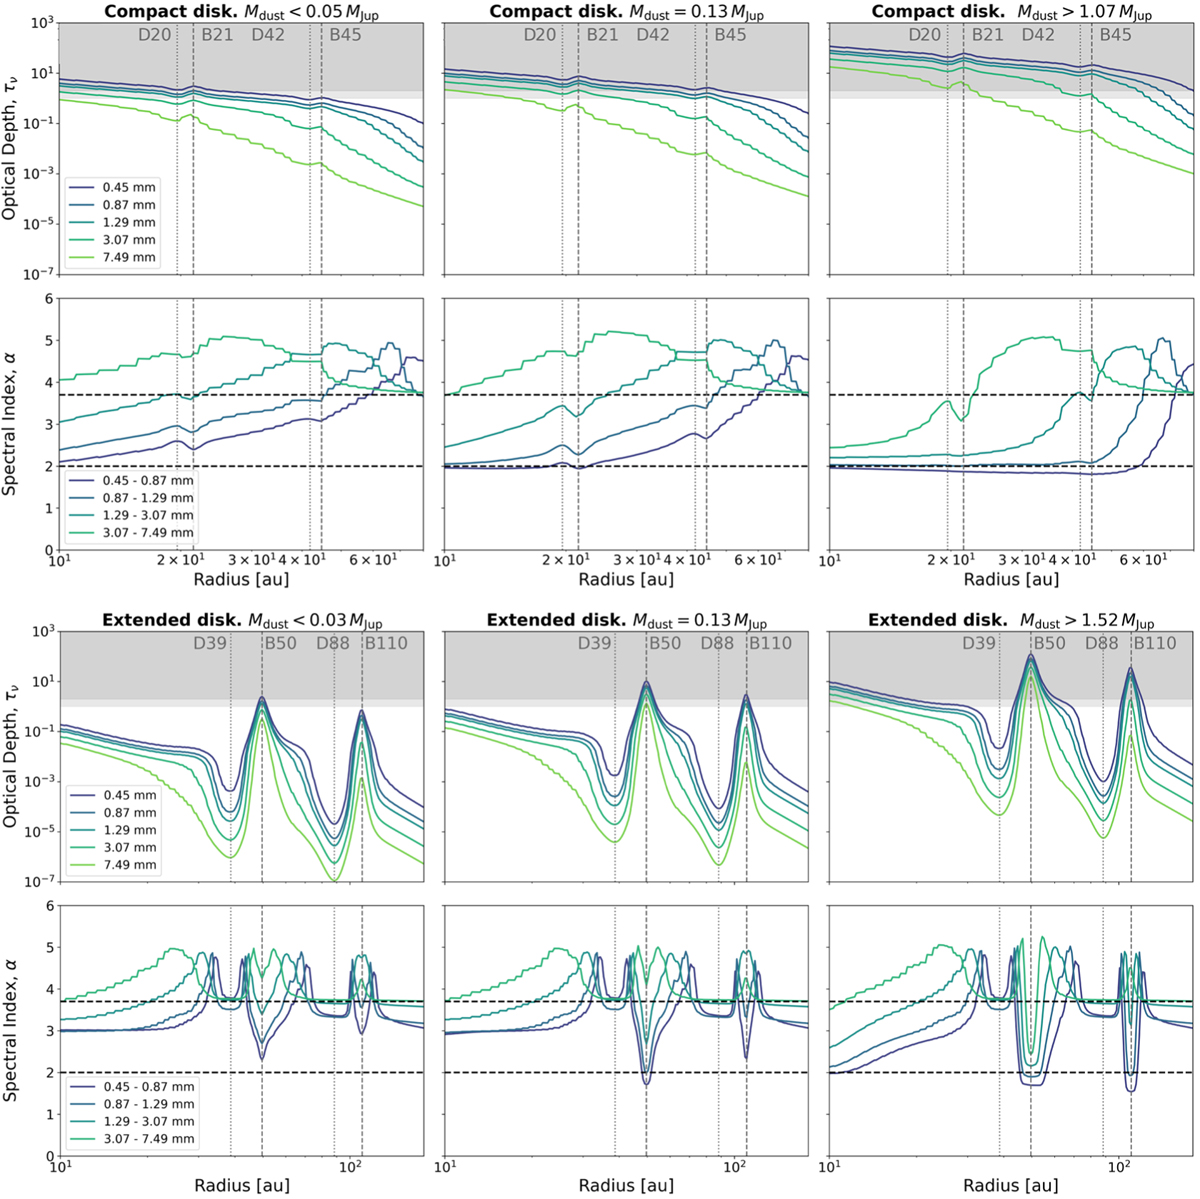
Fig. 2
Download original image
Optical depths (upper row) and spectral indices (lower row) computed for the compact (top figure) and the extended disk (bottom figure) for the three scenarios: (i) dust-poor disks with optically thin emission at both 3 mm and 7 mm (left); (ii) dust-average disks with optically thick emission at 3 mm and thin at 7 mm (middle); and (iii) dust-rich disks with optically thick emission at both 3 and 7 mm (right). The dust masses that give rise to these optical properties (for fixed maximum grain size and distance) are (from left to right) 0.06 MJup, 0.14 MJup, and 1.10 MJup for the compact disk; and 0.03 MJup, 0.13 MJup, and 1.53 MJup for the extended disk. The vertical gray lines represent the position of the bright (B) and dark (D) rings in the dust surface density profile. The horizontal lines in the spectral indices plots indicate α = 3.7 (typical value in the ISM) and α = 2.0 (optically thick emission in the Rayleigh-Jeans limit). The dark gray shaded region in the optical depth plots indicate τ > 2, the light gray region τ > 1.
Current usage metrics show cumulative count of Article Views (full-text article views including HTML views, PDF and ePub downloads, according to the available data) and Abstracts Views on Vision4Press platform.
Data correspond to usage on the plateform after 2015. The current usage metrics is available 48-96 hours after online publication and is updated daily on week days.
Initial download of the metrics may take a while.