Fig. B.1
Download original image
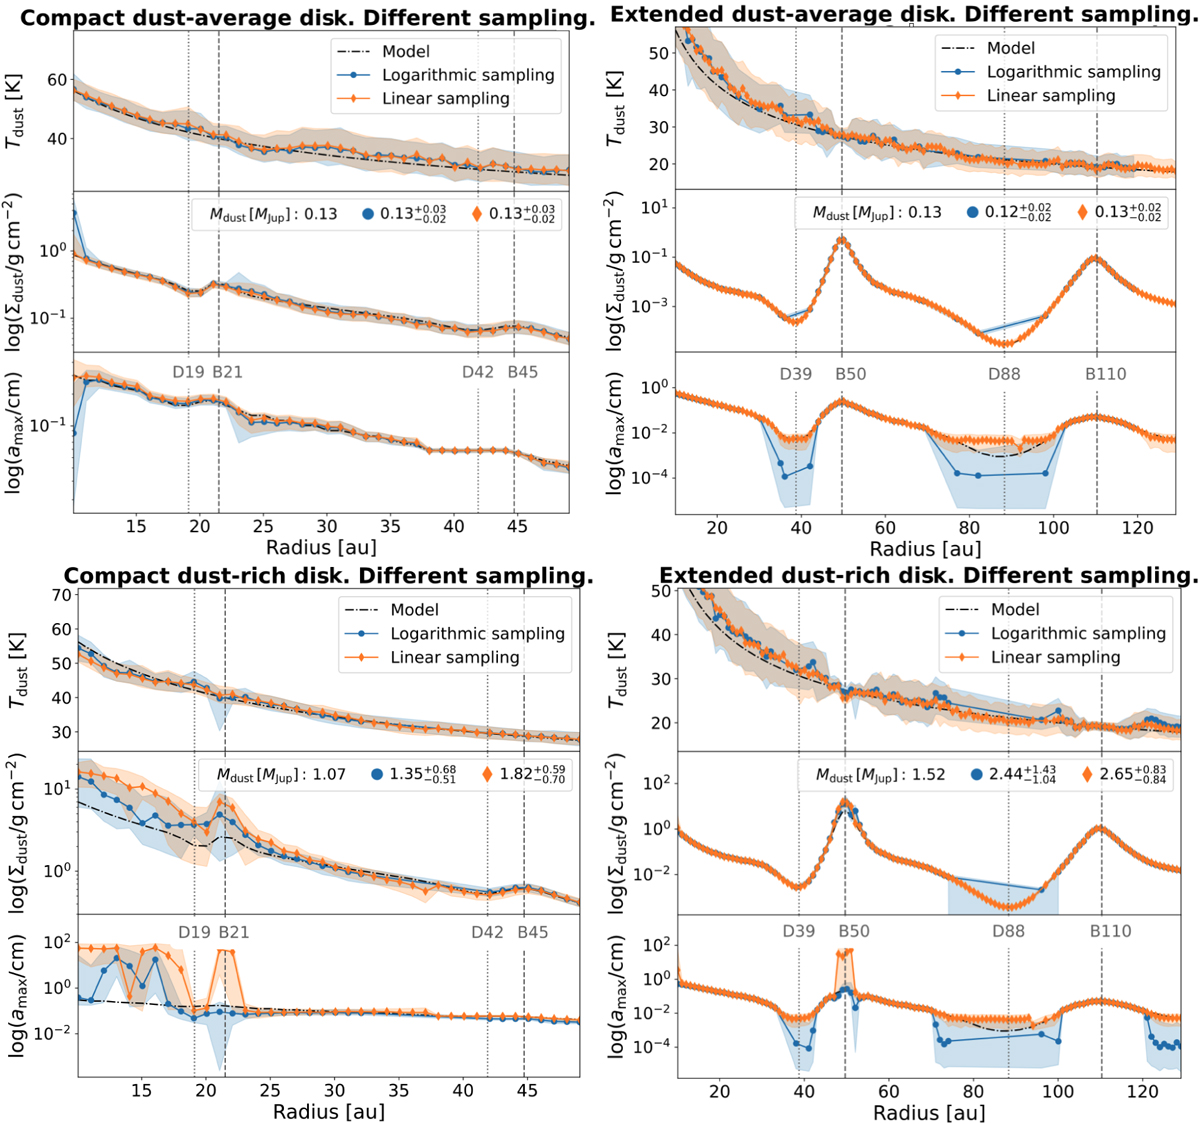
Dust temperature (top panel), dust surface density (middle panel), and maximum grain size (bottom panel) measured from an SED analysis of the dust-average (top plots) and dust-rich (bottom plots) compact (left) and extended (right) disk models (see Sect. 4.1). The SED includes emission from 0.87 mm to 7.46 mm, simulated with infinite resolution. The orange solution is obtained by linearly sampling the parameter space, the blue solution with a logarithmic sampling. The continuum line represents the 50th percentiles of the marginalized probability distribution of the parameters, the shaded area extends from the 16th to the 84th percentiles. The black line indicates the dust properties of the models. The vertical gray lines represent the positions of the bright (B) and dark (D) gaps in the dust surface density profile.
Current usage metrics show cumulative count of Article Views (full-text article views including HTML views, PDF and ePub downloads, according to the available data) and Abstracts Views on Vision4Press platform.
Data correspond to usage on the plateform after 2015. The current usage metrics is available 48-96 hours after online publication and is updated daily on week days.
Initial download of the metrics may take a while.