Fig. 1
Download original image
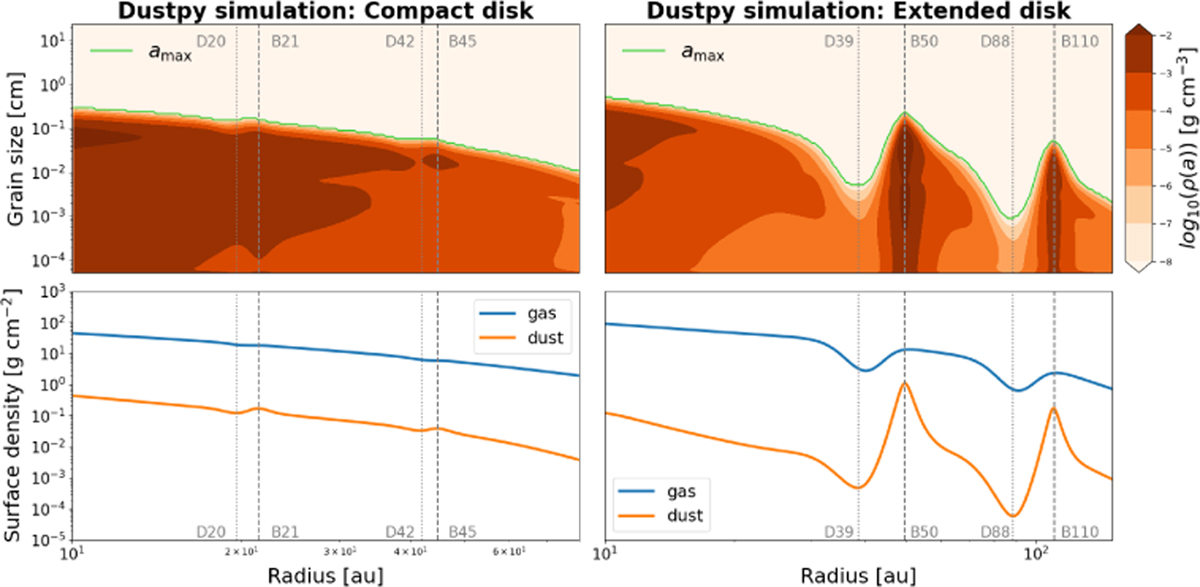
DustPy outputs at 1 Myr for the compact (left panel) and the extended disk models (right panel). Top panel: grain size distribution of the dust particles as a function of the radial distance from the star. At each radius, the maximum grain size, is highlighted in lime green. Bottom panel: radial profiles of gas (in blue) and dust (in orange) total column densities. The vertical gray lines represent the position of the bright (B) and dark (D) gaps in the dust surface density profile.
Current usage metrics show cumulative count of Article Views (full-text article views including HTML views, PDF and ePub downloads, according to the available data) and Abstracts Views on Vision4Press platform.
Data correspond to usage on the plateform after 2015. The current usage metrics is available 48-96 hours after online publication and is updated daily on week days.
Initial download of the metrics may take a while.