Fig. 5.
Download original image
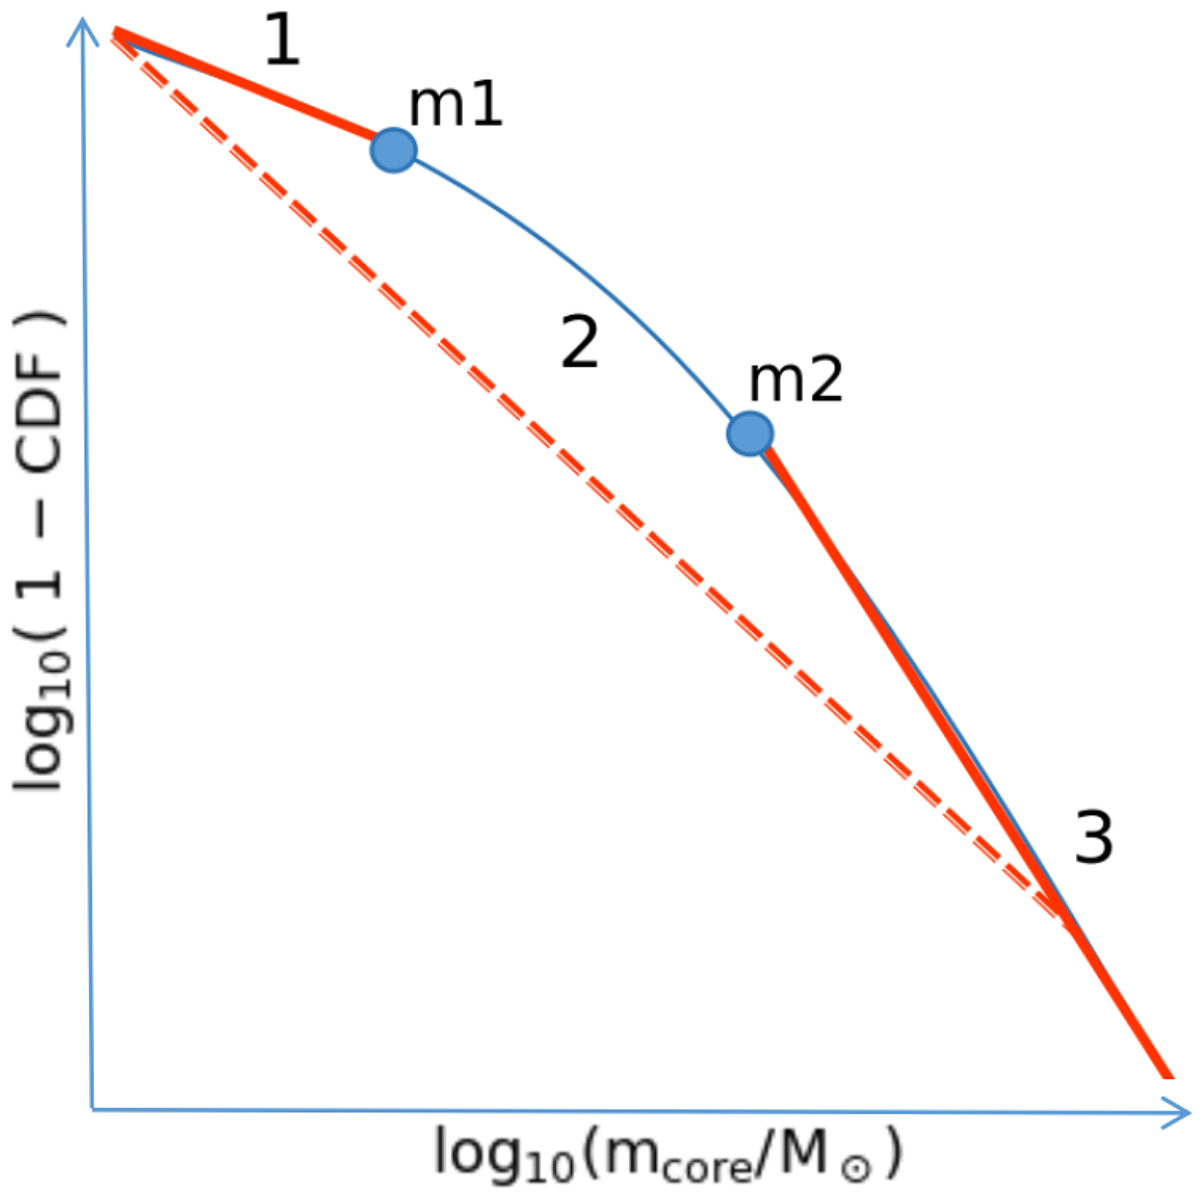
The synthesized CMF can be roughly divided into three segments, i.e., “1”, “2”, and “3”. Segment “2” is the transition part. “m1” and “m2” mark the mass range of the transition. Segment “3” is the real CMF of high-mass cores. The dashed red line is the observed CMF, for which observational biases prevent one from distinguishing the transition, resulting in a combined fit of three different segments with a shallower slope. Thus, the observed top-heavy CMF is an artifact.
Current usage metrics show cumulative count of Article Views (full-text article views including HTML views, PDF and ePub downloads, according to the available data) and Abstracts Views on Vision4Press platform.
Data correspond to usage on the plateform after 2015. The current usage metrics is available 48-96 hours after online publication and is updated daily on week days.
Initial download of the metrics may take a while.