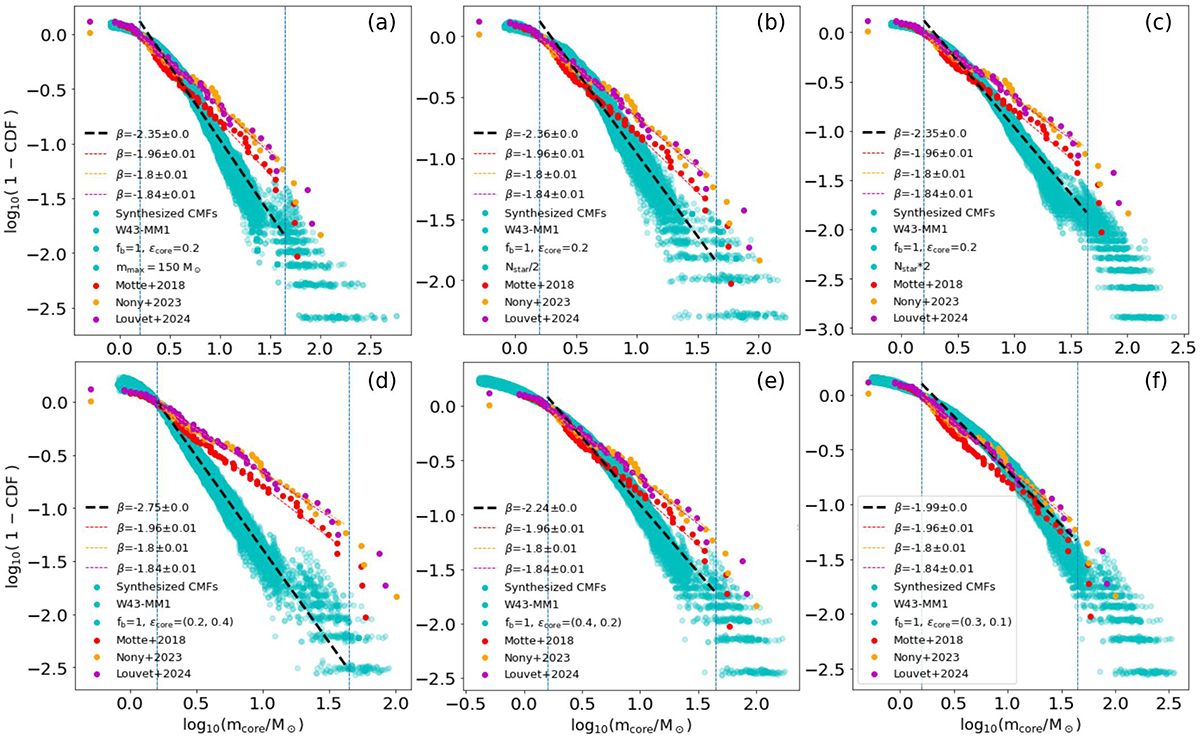
Fig. 2.
Download original image
Complementary cumulative distribution function (CCDF) plot and the linear fitting of the synthesized CMFs (in cyan) for W43-MM1 by setting fb = 1 and ϵcore = 0.2. (a)–(c) The cases of mmax = 150 M⊙, half the original number of stars (Nstar/2) and twice the original number of stars (Nstar * 2), respectively; (d) The case in which ϵcore decreases with decreasing core mass. ϵcore was randomly selected from the range (0.2, 0.4); (e) The case in which ϵcore increases with decreasing core mass. ϵcore was randomly selected from the range (0.2, 0.4); (f) Same as panel e, but ϵcore is in the range (0.1, 0.3). All selected ϵcore in panels d, e, and f are sorted in descending or ascending order. All CCDFs (both observed and synthesized) were normalized to 1 at the mass completeness level marked by the left vertical dashed line.
Current usage metrics show cumulative count of Article Views (full-text article views including HTML views, PDF and ePub downloads, according to the available data) and Abstracts Views on Vision4Press platform.
Data correspond to usage on the plateform after 2015. The current usage metrics is available 48-96 hours after online publication and is updated daily on week days.
Initial download of the metrics may take a while.