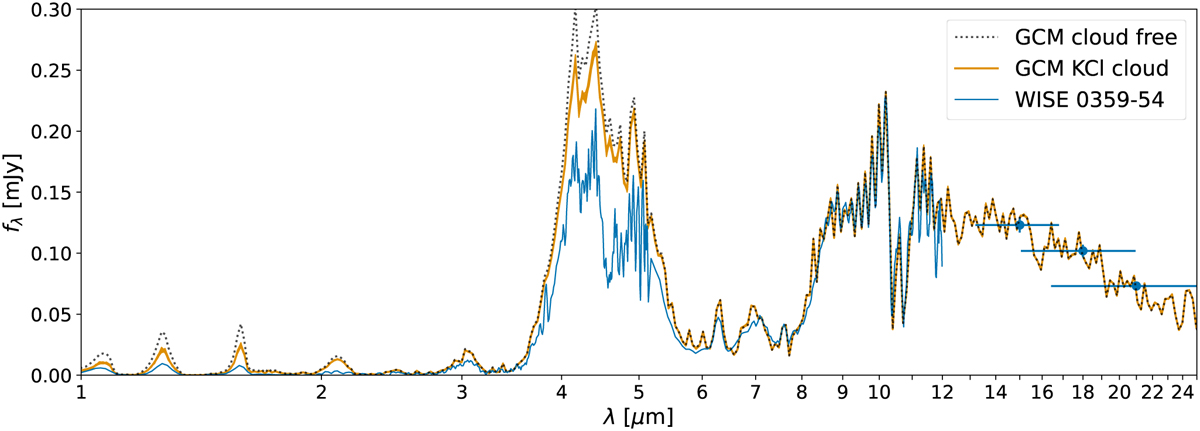
Fig. 4
Download original image
Comparison between the post-processed spectra from the GCM and the WISE 0359-54 JWST spectral data from Beiler et al. (2023). The width of the orange line shows the extent of the maximum and minimum flux across the last 96 hours of simulation. The dotted black line shows the resultant spectra assuming no cloud opacity. The GCM shows decent agreement beyond 7 µm but is not too consistent with the data at bluer wavelengths, suggesting additional cloud opacity is required to dampen the spectral features at the bluer wavelengths.
Current usage metrics show cumulative count of Article Views (full-text article views including HTML views, PDF and ePub downloads, according to the available data) and Abstracts Views on Vision4Press platform.
Data correspond to usage on the plateform after 2015. The current usage metrics is available 48-96 hours after online publication and is updated daily on week days.
Initial download of the metrics may take a while.