Fig. 2
Download original image
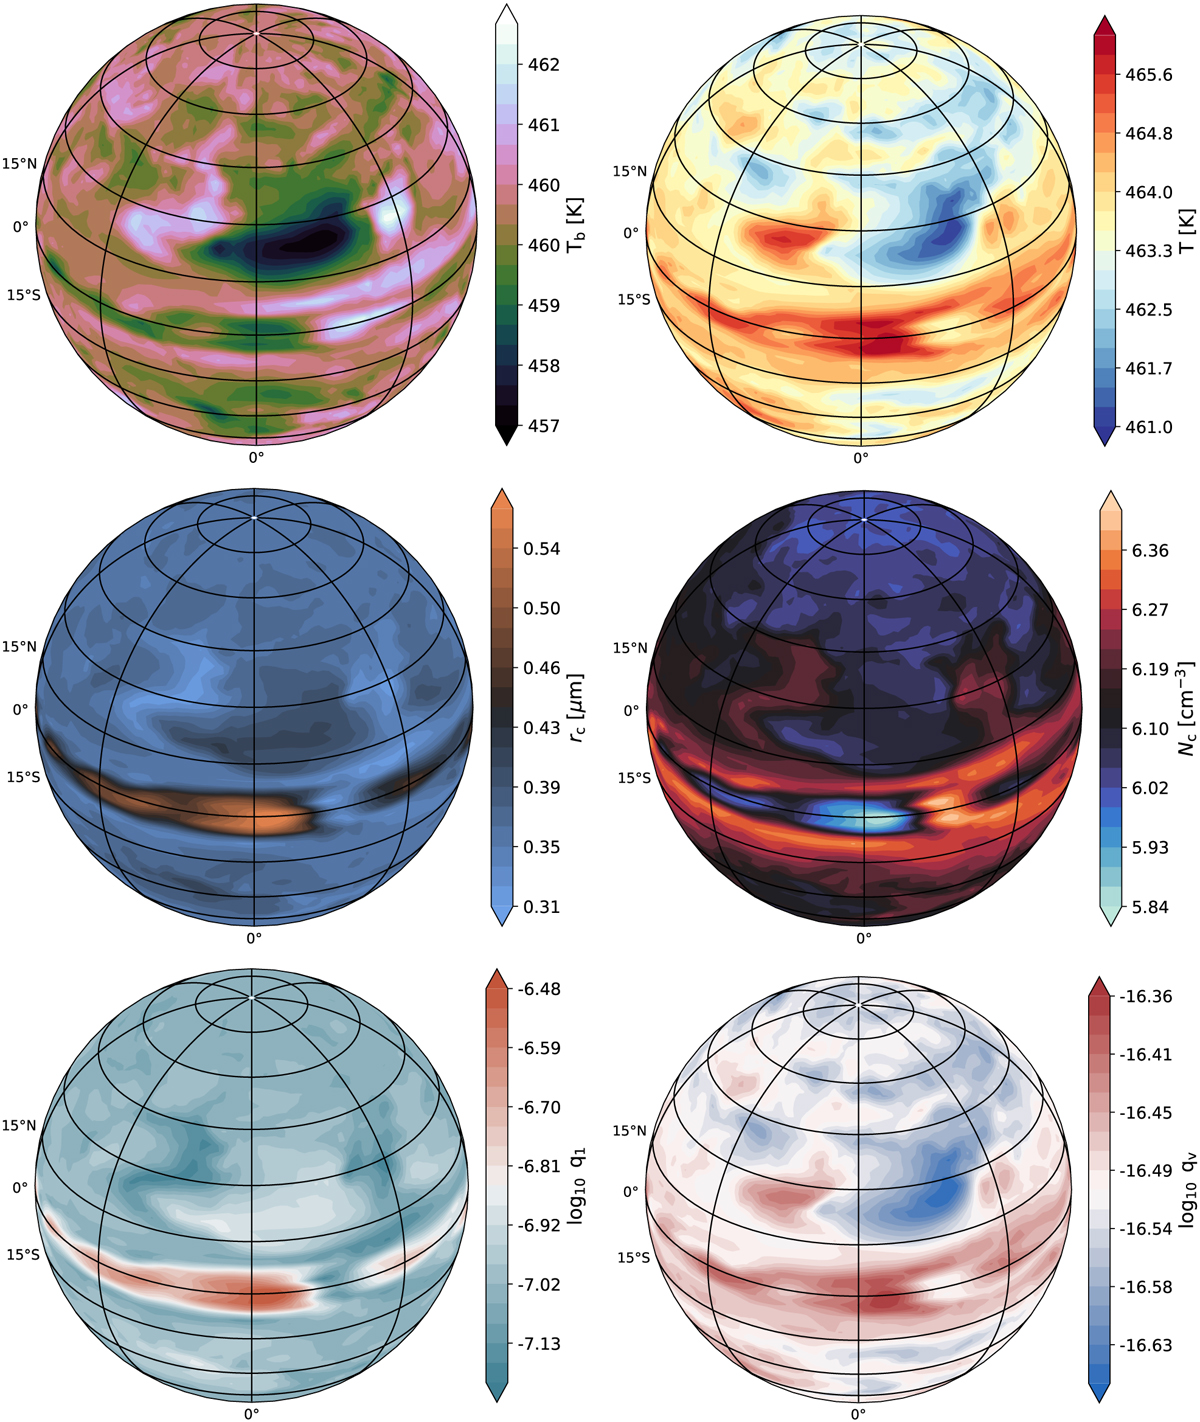
Latitude–longitude projections of the atmospheric conditions at 1104 days of simulation, averaged across the final 4 days at the 0.4 bar pressure level. Top left: brightness temperature, Tb [K]. Top right: atmospheric temperature. Middle left: mass weighted average cloud particle size. Middle right: number density of the cloud particles. Bottom left: mixing ratio of the first moment (q1). Bottom right: mixing ratio of the condensate vapour (qv).
Current usage metrics show cumulative count of Article Views (full-text article views including HTML views, PDF and ePub downloads, according to the available data) and Abstracts Views on Vision4Press platform.
Data correspond to usage on the plateform after 2015. The current usage metrics is available 48-96 hours after online publication and is updated daily on week days.
Initial download of the metrics may take a while.